Magnolia: Fire Incidents, Arkansas (AR)
Where are fire incidents reported in Magnolia, AR
Something went wrong! Please refresh the page.
| Fire incidents reported | |
|---|---|
| Sreet name | Count |
| COLUMBIA 27 | 52 |
| HWY 371 | 34 |
| MAIN | 32 |
| COLUMBIA 29 | 22 |
| MULLINS | 22 |
| SOUTH JACKSON | 22 |
| E MAIN | 20 |
| HWY 19 SOUTH | 20 |
| COLUMBIA 47 | 18 |
| HWY 82 EAST | 18 |
| SMITH | 18 |
| US 82 EAST | 18 |
| COLUMBIA 11 | 16 |
| COLUMBIA 78 | 16 |
| HWY 82 | 16 |
| CALHOUN | 14 |
| COLUMBIA 11 EAST | 14 |
| COLUMBIA RD 15 | 14 |
| HWY 19 S | 14 |
| NORTH VINE | 14 |
| VINE | 14 |
| W MAIN | 14 |
| BRICE | 12 |
| COLUMBIA ROAD 36 | 12 |
| EAST MAIN | 12 |
| HEIGHT | 12 |
| HWY 160 | 12 |
| HWY 79 N | 12 |
| HWY 79 SOUTH | 12 |
| RENFROE | 12 |
| Other | 1,011 |
2003 - 2018 National Fire Incident Reporting System (NFIRS) incidents
- Incident types reported to NFIRS in Magnolia, AR
- 1,54984.1%Fire
- 1407.6%False Alarm
- 874.7%Hazardous Condition
- 341.8%Good Intent Call
- 261.4%Service Call
- 20.1%Overpressure Rupture
- Fire incident types reported to NFIRS in Magnolia, AR
- 69745.0%Outside Fires
- 54134.9%Structure Fires
- 23315.0%Mobile Property/Vehicle Fires
- 785.0%Other
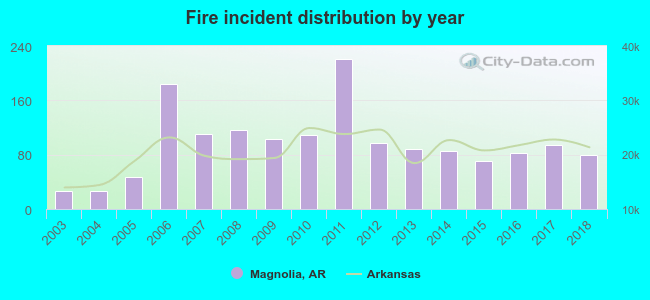 According to the data from the years 2003 - 2018 the average number of fires per year is 97. The highest number of reported fire incidents - 221 took place in 2011, and the least - 26 in 2003. The data has a growing trend.
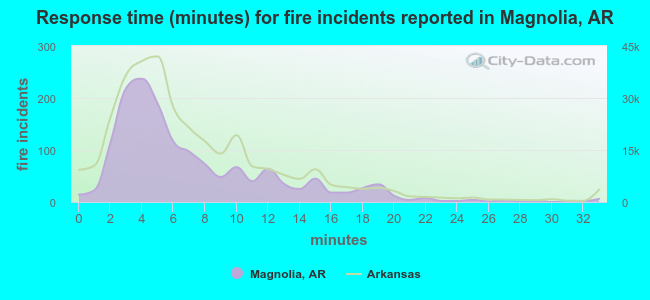 The median response time based on all reported fire incidents is 5 minutes. This is lower compared to the state median value.
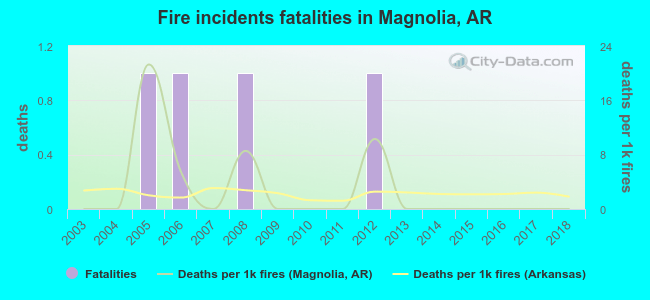 According to the data from the years 2003 - 2018 the average number of fire-related fatalities per year is 0. The highest number of reported deaths - 1 took place in 2005, and the lowest - 0 in 2003. The data has a constant trend.
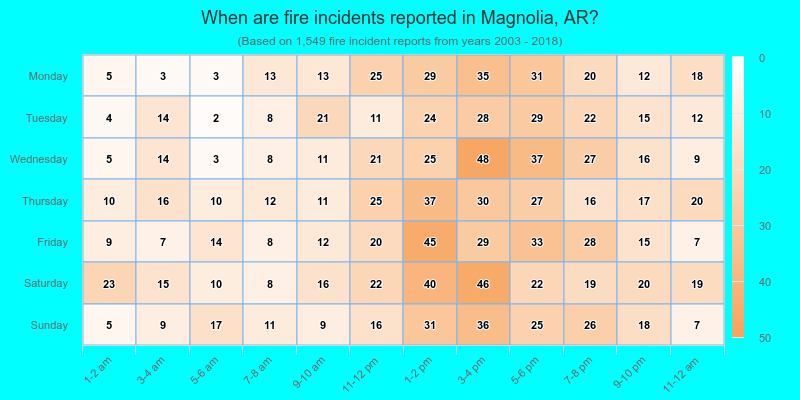
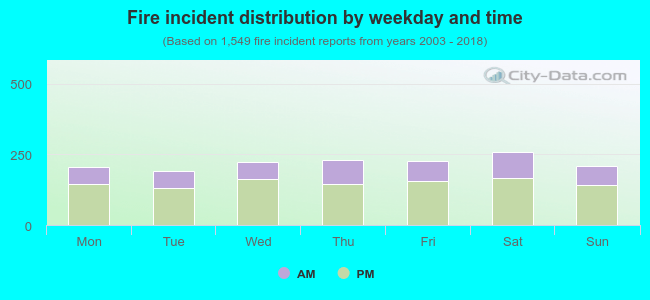 32.2% incidents where reported in the morning and 67.8% in the evening. The most fires (16.8%) took place on Saturday, and the least (12.3%) on Tuesday.
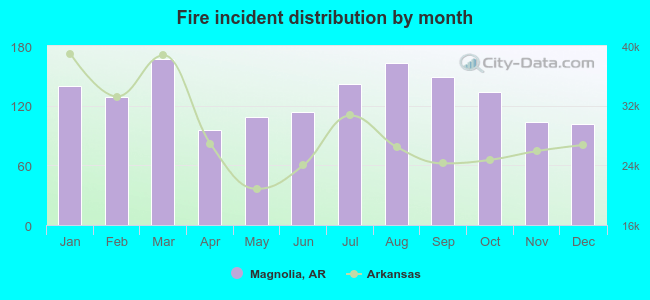 Based on the 1,549 reports from years 2003 - 2018 most fires (10.8%) took place during March, and the least (6.2%) in April.
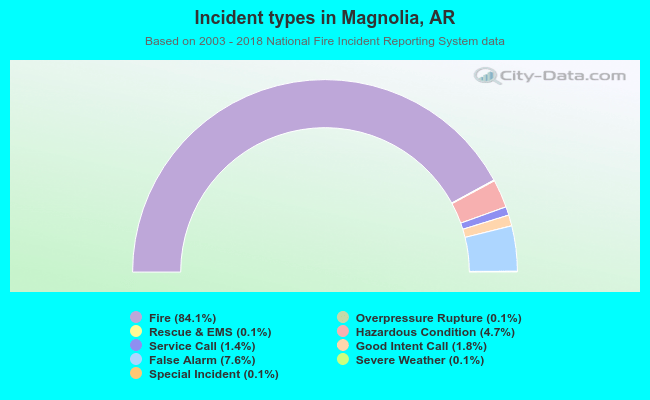 Out of all 1,841 cases reported during the years 2003 - 2018, the most belonged to the categories: Fire (84.1%), False Alarm (7.6%), and Hazardous Condition (4.7%).
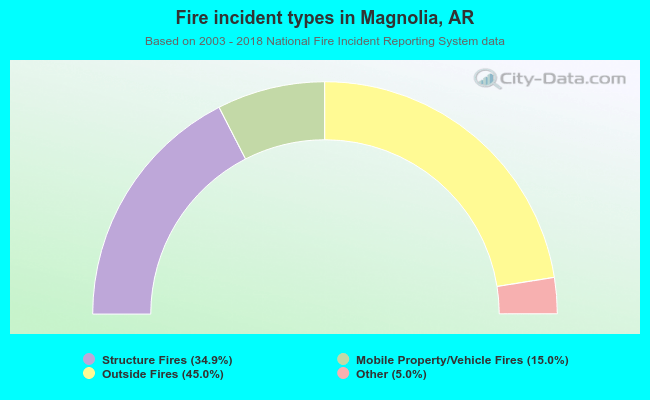 When looking into fire subcategories, the most reports belonged to: Outside Fires (45.0%), and Structure Fires (34.9%).