Hope: Fire Incidents, Arkansas (AR)
Where are fire incidents reported in Hope, AR
Something went wrong! Please refresh the page.
| Fire incidents reported | |
|---|---|
| Sreet name | Count |
| HEMPSTEAD 3 | 28 |
| HWY 32 | 26 |
| HWY 73 | 26 |
| 355 WEST | 24 |
| HEMPSTEAD 3 CR | 24 |
| 29 SOUTH | 20 |
| FAIR PARK | 20 |
| HAZEL | 20 |
| 100 TEMPLE DRIVE | 18 |
| ELM | 18 |
| HWY 278 | 18 |
| I-30 | 18 |
| HWY 29 | 16 |
| HWY 29 S HWY | 16 |
| MAIN | 16 |
| 16TH | 14 |
| HWY 29 SOUTH | 14 |
| 103 NORTH GREENING | 12 |
| HEMPSTEAD 52 | 12 |
| HERVEY | 12 |
| HWY 355 E HWY | 12 |
| HWY 67 WEST | 12 |
| SOUTH END OF HEMPSTEAD 3 | 12 |
| 602 WEST COMPRESS | 10 |
| AVE B | 10 |
| BILL CLINTON BYPASS | 10 |
| HEMP 7 | 10 |
| HEMPSTEAD 120 | 10 |
| HEMPSTEAD 5 | 10 |
| HWY 29 S | 10 |
| Other | 1,604 |
2002 - 2018 National Fire Incident Reporting System (NFIRS) incidents
- Incident types reported to NFIRS in Hope, AR
- 2,08264.3%Fire
- 45113.9%Rescue & EMS
- 2427.5%False Alarm
- 1845.7%Hazardous Condition
- 1404.3%Service Call
- 1263.9%Good Intent Call
- 60.2%Overpressure Rupture
- 50.2%Severe Weather
- Fire incident types reported to NFIRS in Hope, AR
- 1,27561.2%Outside Fires
- 48923.5%Structure Fires
- 25212.1%Mobile Property/Vehicle Fires
- 663.2%Other
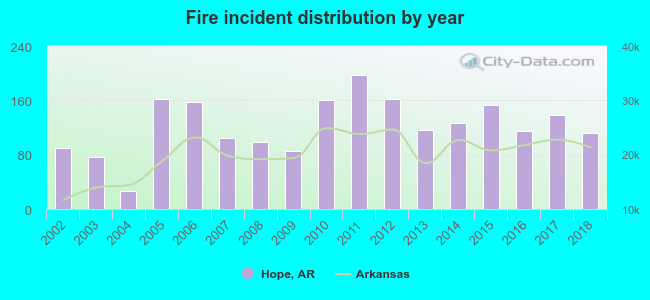 According to the data from the years 2002 - 2018 the average number of fires per year is 122. The highest number of fire incidents - 198 took place in 2011, and the least - 26 in 2004. The data has a rising trend.
The average number of yearly fire incidents per 10k residents in Hope, AR compared to nearest cities:
(Note: Based on data for the last 3 years, including only cities with population 5,000 and above)
| Hope: | 121.6 |
| Texarkana: | 83.2 |
| Magnolia: | 74.6 |
| Arkadelphia: | 80.4 |
| Camden: | 110.9 |
| De Queen: | 18.3 |
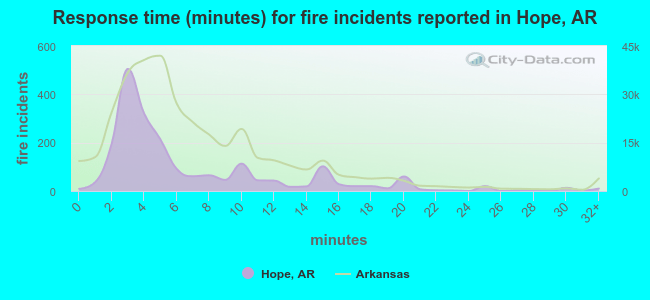 The median response time based on all reported fire incidents is 4 minutes. This is lower compared to the state median value.
The median response time in Hope, AR compared to nearest cities:
(Note: Based on data for all years, including only cities with at least 500 fire incidents)
| Hope: | 4 minutes |
| Nashville: | 7 minutes |
| Waldo: | 9 minutes |
| Texarkana: | 5 minutes |
| Ashdown: | 7 minutes |
| Fouke: | 10 minutes |
| Magnolia: | 5 minutes |
| Arkadelphia: | 5 minutes |
| Camden: | 5 minutes |
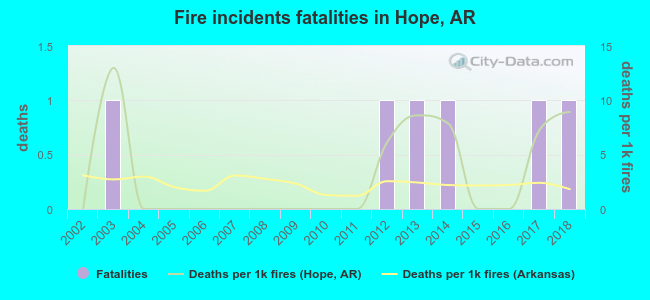 According to the data from the years 2002 - 2018 the average number of fire-related fatalities per year is 0. The highest number of reported deaths - 1 took place in 2003, and the lowest - 0 in 2002. The data has a rising trend.
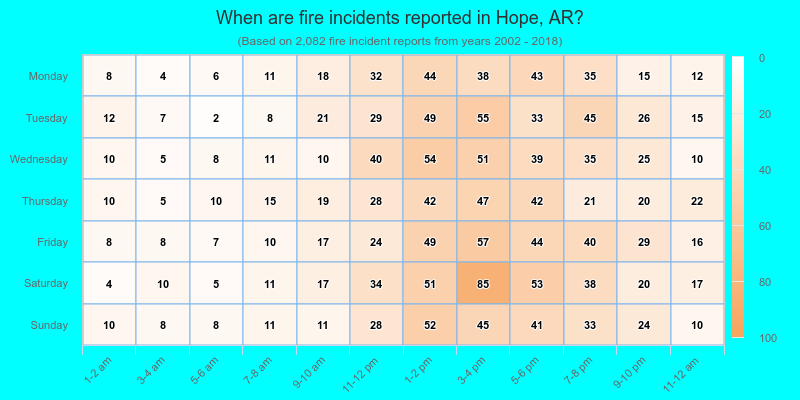
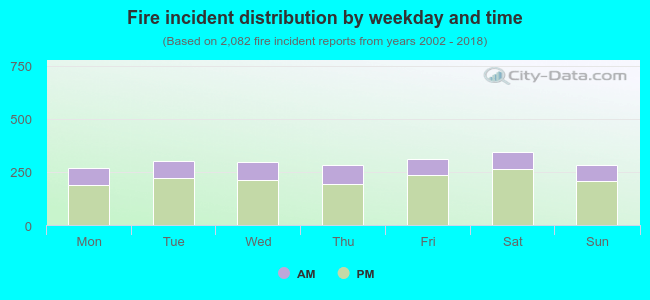 26.9% incidents where reported in the morning and 73.1% in the evening. The most fires (16.6%) took place on Saturday, and the least (12.8%) on Monday.
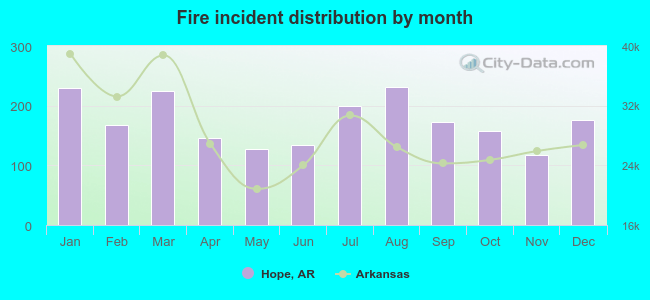 Based on the 2,082 reports from years 2002 - 2018 most fires (11.1%) took place during August, and the least (5.6%) in November.
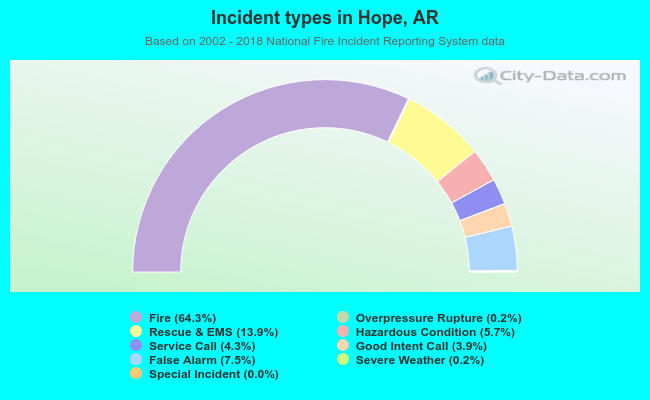 Out of all 3,237 cases reported during the years 2002 - 2018, the most belonged to the categories: Fire (64.3%), Rescue & EMS (13.9%), and False Alarm (7.5%).
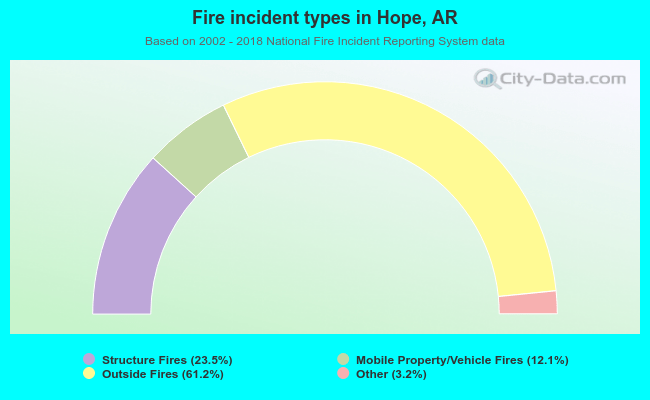 When looking into fire subcategories, the most reports belonged to: Outside Fires (61.2%), and Structure Fires (23.5%).