Lititz: Fire Incidents, Pennsylvania (PA)
Where are fire incidents reported in Lititz, PA
Something went wrong! Please refresh the page.
|
| |||||||||||||||||||||||||||||||||||||||||||||||||||||||||||||||||||||||||||||||||||||||||||||||||||||||||||||
2002 - 2018 National Fire Incident Reporting System (NFIRS) incidents
- Incident types reported to NFIRS in Lititz, PA
- 1,50632.1%Fire
- 1,20825.7%Hazardous Condition
- 57812.3%Rescue & EMS
- 55211.8%Good Intent Call
- 48910.4%False Alarm
- 2926.2%Service Call
- 461.0%Special Incident
- 190.4%Severe Weather
- Fire incident types reported to NFIRS in Lititz, PA
- 1,09672.8%Structure Fires
- 30220.1%Outside Fires
- 926.1%Mobile Property/Vehicle Fires
- 161.1%Other
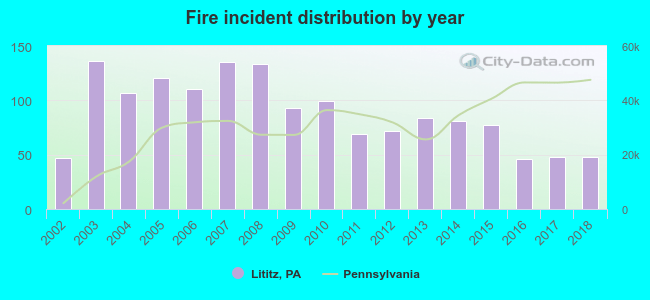 According to the data from the years 2002 - 2018 the average number of fires per year is 89. The highest number of reported fires - 136 took place in 2003, and the least - 46 in 2016. The data has a rising trend.
The average number of yearly fire incidents per 10k residents in Lititz, PA compared to nearest cities:
(Note: Based on data for the last 3 years, including only cities with population 5,000 and above)
| Lititz: | 50.4 |
| Ephrata: | 53.0 |
| Lancaster: | 100.2 |
| Millersville: | 27.5 |
| Mount Joy: | 82.4 |
| New Holland: | 72.6 |
| Willow Street: | 31.7 |
| Columbia: | 89.6 |
| Lebanon: | 78.3 |
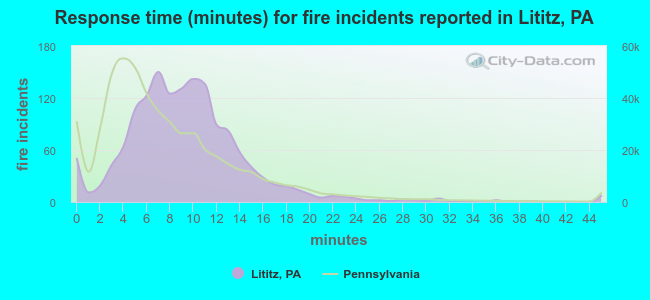 The median response time based on all reported fire incidents is 9 minutes. This is higher than the Pennsylvania median value.
The median response time in Lititz, PA compared to nearest cities:
(Note: Based on data for all years, including only cities with at least 500 fire incidents)
| Lititz: | 9 minutes |
| Manheim: | 10 minutes |
| Ephrata: | 8 minutes |
| Landisville: | 9 minutes |
| Lancaster: | 7 minutes |
| Denver: | 9 minutes |
| Millersville: | 8 minutes |
| Mount Joy: | 8 minutes |
| New Holland: | 7 minutes |
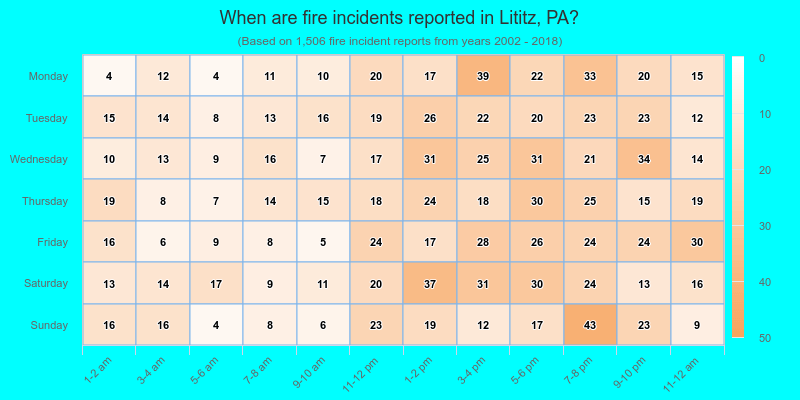
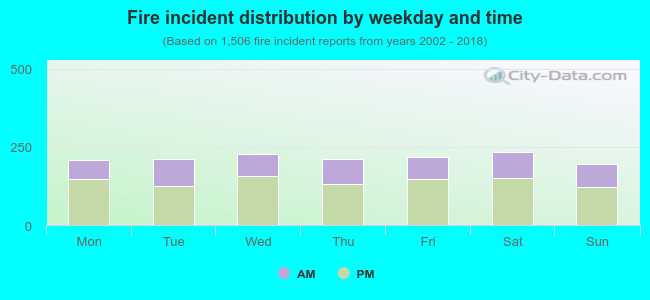 34.8% incidents where reported in the morning and 65.2% in the evening. The most fires (15.6%) took place on Saturday, and the least (13.0%) on Sunday.
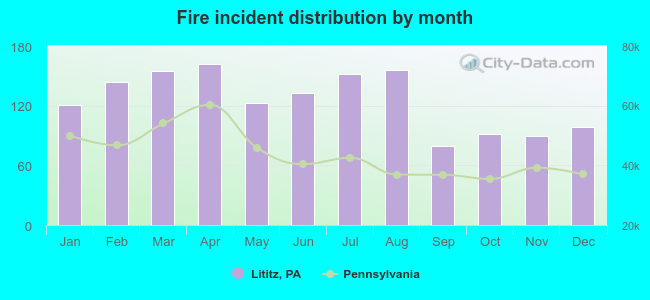 According to the 1,506 reports from years 2002 - 2018 most fires (10.8%) took place during April, and the least (5.2%) in September.
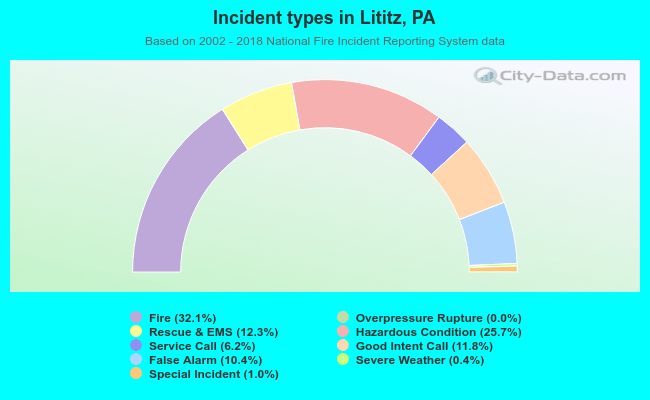 Out of all 4,692 cases reported during the years 2002 - 2018, the most belonged to the categories: Fire (32.1%), Hazardous Condition (25.7%), and Rescue & EMS (12.3%).
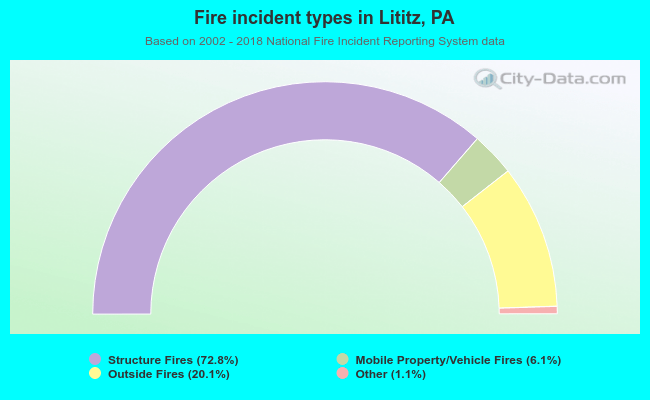 When looking into fire subcategories, the most reports belonged to: Structure Fires (72.8%), and Outside Fires (20.1%).