Lancaster: Fire Incidents, Pennsylvania (PA)
Where are fire incidents reported in Lancaster, PA
Something went wrong! Please refresh the page.
| Fire incidents reported | |
|---|---|
| Sreet name | Count |
| KING ST | 488 |
| LITITZ PIKE | 404 |
| COLUMBIA AVE | 402 |
| LINCOLN HWY | 360 |
| MANHEIM PIKE | 314 |
| PRINCE ST | 312 |
| QUEEN ST | 304 |
| DUKE ST | 288 |
| HARRISBURG PIKE | 284 |
| OREGON PIKE | 276 |
| FRUITVILLE PIKE | 268 |
| MARIETTA AVE | 238 |
| RT 30 | 188 |
| ORANGE ST | 186 |
| EDEN RD | 180 |
| SWARR RUN RD | 150 |
| OLD PHILADELPHIA PIKE | 140 |
| LIME ST | 138 |
| WALNUT ST | 130 |
| CENTERVILLE RD | 126 |
| ROHRERSTOWN RD | 126 |
| JAMES ST | 122 |
| LINCOLN HIGHWAY EAST | 120 |
| HEMPLAND RD | 106 |
| GREENFIELD RD | 104 |
| PLEASURE RD | 104 |
| ANN ST | 102 |
| GREENLAND DR | 102 |
| MANOR ST | 100 |
| NEW HOLLAND AVE | 94 |
| Other | 3,815 |
2002 - 2018 National Fire Incident Reporting System (NFIRS) incidents
- Incident types reported to NFIRS in Lancaster, PA
- 10,07124.1%Fire
- 9,91623.7%Rescue & EMS
- 8,95421.4%Hazardous Condition
- 5,24512.5%False Alarm
- 4,65311.1%Good Intent Call
- 2,7206.5%Service Call
- 1610.4%Special Incident
- 780.2%Severe Weather
- 730.2%Overpressure Rupture
- Fire incident types reported to NFIRS in Lancaster, PA
- 6,82867.8%Structure Fires
- 1,73617.2%Outside Fires
- 1,22212.1%Mobile Property/Vehicle Fires
- 2852.8%Other
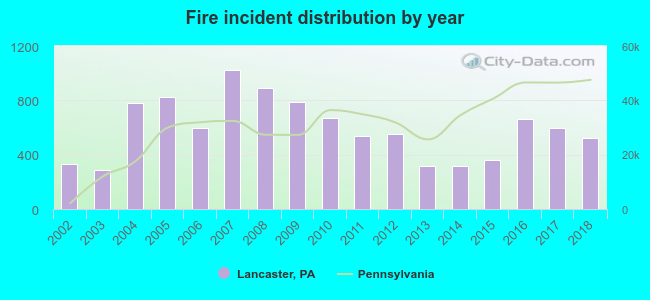 Based on the data from the years 2002 - 2018 the average number of fire incidents per year is 592. The highest number of fires - 1,022 took place in 2007, and the least - 286 in 2003. The data has an increasing trend.
The average number of yearly fire incidents per 10k residents in Lancaster, PA compared to nearest cities:
(Note: Based on data for the last 3 years, including only cities with population 5,000 and above)
| Lancaster: | 100.2 |
| Millersville: | 27.5 |
| Willow Street: | 31.7 |
| Lititz: | 50.4 |
| Columbia: | 89.6 |
| Ephrata: | 53.0 |
| Mount Joy: | 82.4 |
| New Holland: | 72.6 |
| Elizabethtown: | 78.4 |
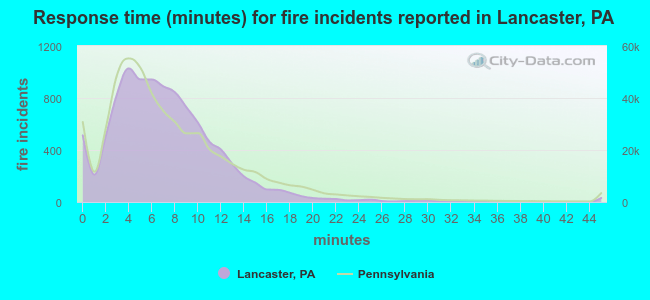 The median response time based on all reported fire incidents is 7 minutes. This is comparable to the Pennsylvania median value.
The median response time in Lancaster, PA compared to nearest cities:
(Note: Based on data for all years, including only cities with at least 500 fire incidents)
| Lancaster: | 7 minutes |
| Millersville: | 8 minutes |
| Landisville: | 9 minutes |
| Strasburg: | 9 minutes |
| Lititz: | 9 minutes |
| Paradise: | 7 minutes |
| Manheim: | 10 minutes |
| Columbia: | 6 minutes |
| Ephrata: | 8 minutes |
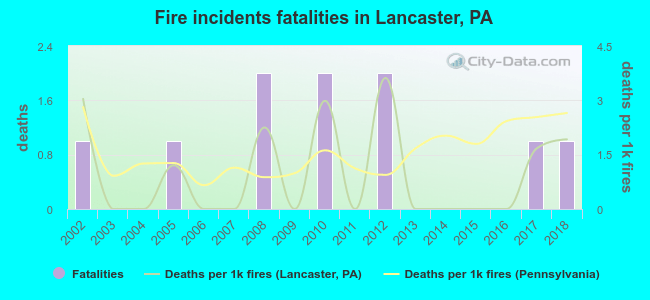 Based on the data from the years 2002 - 2018 the average number of fire-related fatalities per year is 1. The highest number of deaths - 2 took place in 2008, and the lowest - 0 in 2003. The data has a constant trend.
The average number of fatalities per 1,000 fire incidents is 1. This indicator was the highest - 4 in 2012, and the lowest 0 in 2003. The trend for fatalities per 1,000 fire incidents is declining. Compared to the Pennsylvania value the number of fatalities per 1,000 incidents is lower.
Based on the data from the years 2002 - 2018 the average number of fire-related fatalities per year is 1. The highest number of deaths - 2 took place in 2008, and the lowest - 0 in 2003. The data has a constant trend.
The average number of fatalities per 1,000 fire incidents is 1. This indicator was the highest - 4 in 2012, and the lowest 0 in 2003. The trend for fatalities per 1,000 fire incidents is declining. Compared to the Pennsylvania value the number of fatalities per 1,000 incidents is lower.Deaths per 1,000 incidents in Lancaster, PA compared to nearest cities:
(Note: Based on data for all years, including only cities with at least 2,500 fire incidents)
| Lancaster: | 1.0 |
| Columbia: | 0.4 |
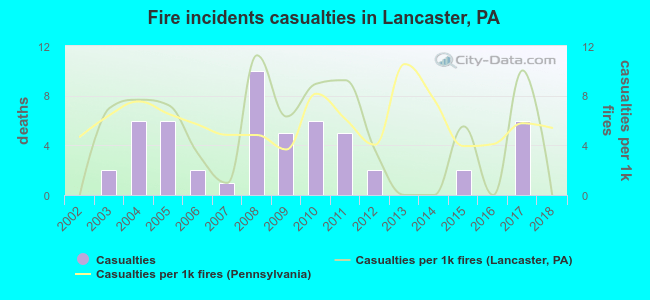 According to the data from the years 2002 - 2018 the average number of fire-related yearly casualties is 3. The highest number of injuries - 10 took place in 2008, and the lowest - 0 in 2002. The data has a constant trend.
The average number of injuries per 1,000 fire incidents is 5. This indicator was the highest - 11 in 2008, and the lowest 0 in 2002. The trend for casualties per 1,000 fires is constant. Compared to the Pennsylvania value the number of casualties per 1,000 fire incidents is about the same.
According to the data from the years 2002 - 2018 the average number of fire-related yearly casualties is 3. The highest number of injuries - 10 took place in 2008, and the lowest - 0 in 2002. The data has a constant trend.
The average number of injuries per 1,000 fire incidents is 5. This indicator was the highest - 11 in 2008, and the lowest 0 in 2002. The trend for casualties per 1,000 fires is constant. Compared to the Pennsylvania value the number of casualties per 1,000 fire incidents is about the same.Casualties per 1,000 incidents in Lancaster, PA compared to nearest cities:
(Note: Based on data for all years, including only cities with at least 500 fire incidents)
| Lancaster: | 5.3 |
| Millersville: | 2.0 |
| Landisville: | 0.0 |
| Strasburg: | 0.0 |
| Lititz: | 2.7 |
| Paradise: | 0.0 |
| Manheim: | 3.5 |
| Columbia: | 2.5 |
| Ephrata: | 8.2 |
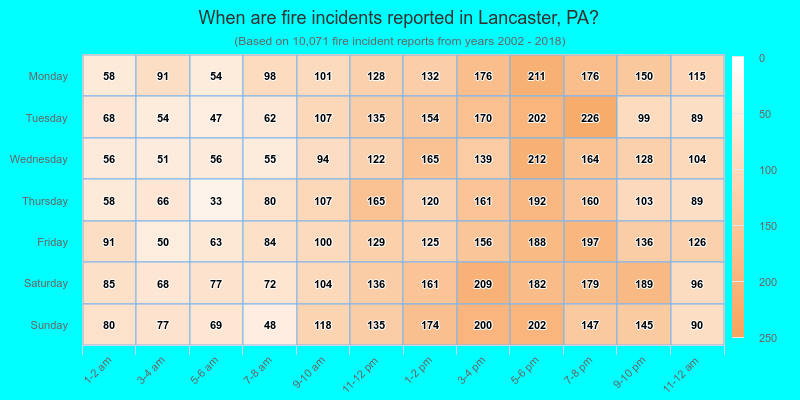
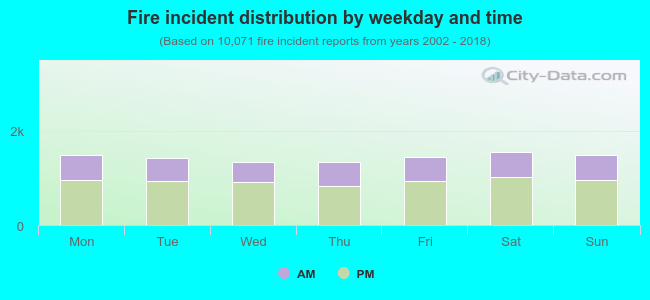 35.1% incidents where reported in the morning and 64.9% in the evening. The most fires (15.5%) took place on Saturday, and the least (13.2%) on Thursday.
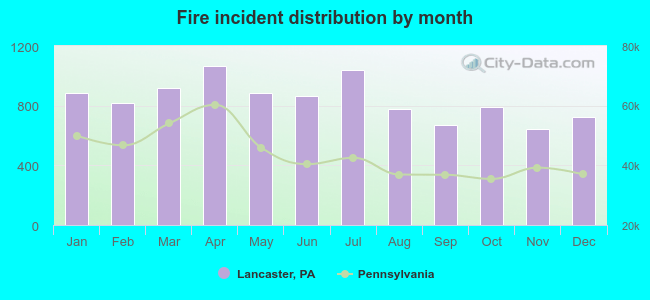 According to the 10,071 reports from years 2002 - 2018 most fires (10.6%) took place during April, and the least (6.4%) in November.
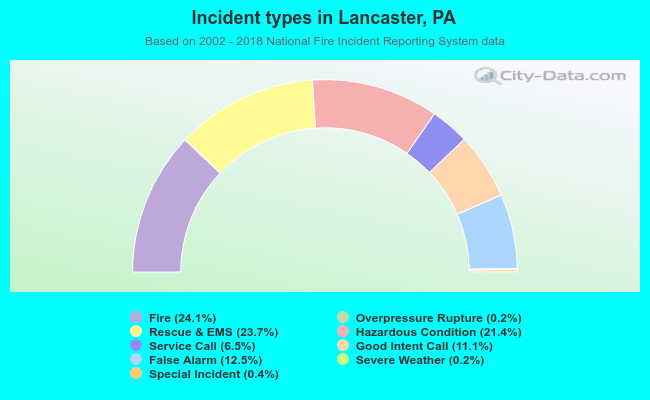 Out of all 41,871 cases reported during the years 2002 - 2018, the most belonged to the categories: Fire (24.1%), Rescue & EMS (23.7%), and Hazardous Condition (21.4%).
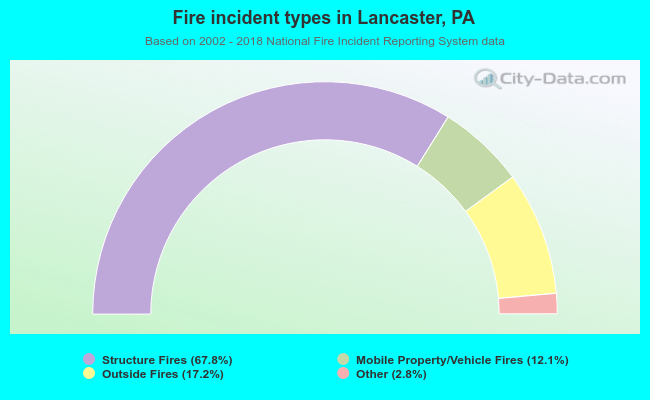 When looking into fire subcategories, the most incidents belonged to: Structure Fires (67.8%), and Outside Fires (17.2%).