King: Fire Incidents, North Carolina (NC)
Where are fire incidents reported in King, NC
Something went wrong! Please refresh the page.
| Fire incidents reported | |
|---|---|
| Sreet name | Count |
| MAIN ST | 240 |
| DALTON RD | 168 |
| 52 HWY | 122 |
| MEADOWBROOK DR | 108 |
| NEWSOME RD | 86 |
| YMCA CAMP RD | 80 |
| 66 HWY | 78 |
| KING ST | 66 |
| INGRAM DR | 62 |
| MOORE RD | 62 |
| SLATE RD | 54 |
| MOUNTAIN VIEW RD | 52 |
| PLANTATION DR | 50 |
| NC 66 HWY | 46 |
| US 52 EXPY | 46 |
| BUTNER RD | 44 |
| WESTMORELAND RD | 44 |
| WHITE RD | 44 |
| TRINITY CHURCH RD | 40 |
| JEFFERSON CHURCH RD | 38 |
| PRIDDY RD | 38 |
| BROWN RD | 34 |
| SPAINHOUR RD | 34 |
| WEATHERFORD DR | 34 |
| LEEDS LN | 32 |
| KIRBY RD | 30 |
| MOSER RD | 30 |
| CHESTNUT GROVE RD | 28 |
| CROMER RD | 28 |
| JONES RD | 28 |
| Other | 527 |
2002 - 2018 National Fire Incident Reporting System (NFIRS) incidents
- Incident types reported to NFIRS in King, NC
- 8,00749.8%Rescue & EMS
- 2,37314.8%Fire
- 2,27214.1%Good Intent Call
- 1,70610.6%Service Call
- 9826.1%Hazardous Condition
- 6844.3%False Alarm
- 410.3%Severe Weather
- Fire incident types reported to NFIRS in King, NC
- 1,13848.0%Structure Fires
- 62726.4%Outside Fires
- 34314.5%Other
- 26511.2%Mobile Property/Vehicle Fires
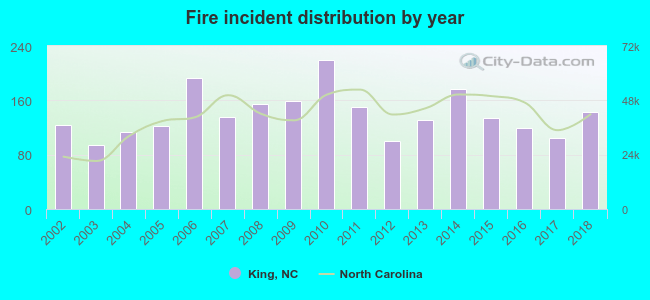 Based on the data from the years 2002 - 2018 the average number of fires per year is 140. The highest number of reported fire incidents - 219 took place in 2010, and the least - 94 in 2003. The data has an increasing trend.
The average number of yearly fire incidents per 10k residents in King, NC compared to nearest cities:
(Note: Based on data for the last 3 years, including only cities with population 5,000 and above)
| King: | 177.6 |
| Lewisville: | 43.7 |
| Clemmons: | 41.7 |
| Kernersville: | 86.2 |
| Stokesdale: | 65.5 |
| Mount Airy: | 172.4 |
| Oak Ridge: | 30.8 |
| Summerfield: | 41.2 |
| Mocksville: | 327.2 |
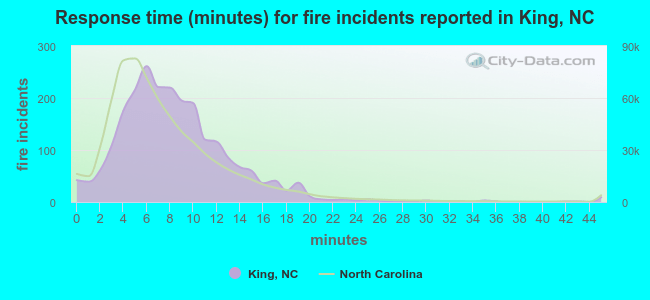 The median response time based on all reported fire incidents is 8 minutes. This is higher than the state median value.
The median response time in King, NC compared to nearest cities:
(Note: Based on data for all years, including only cities with at least 500 fire incidents)
| King: | 8 minutes |
| Rural Hall: | 8 minutes |
| Pinnacle: | 9 minutes |
| East Bend: | 7 minutes |
| Pilot Mountain: | 9 minutes |
| Walnut Cove: | 9 minutes |
| Lewisville: | 7 minutes |
| Winston-Salem: | 4 minutes |
| Walkertown: | 7 minutes |
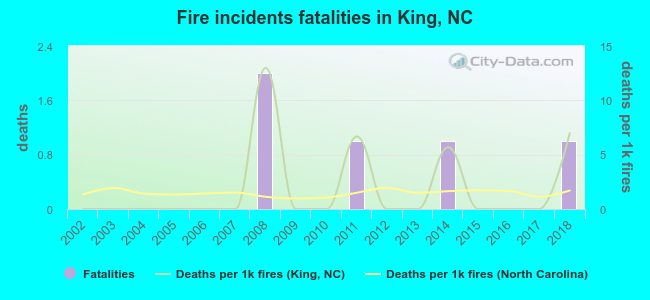 According to the reports from the years 2002 - 2018 the average number of fire-related fatalities per year is 0. The highest number of deaths - 2 took place in 2008, and the lowest - 0 in 2002. The data has a growing trend.
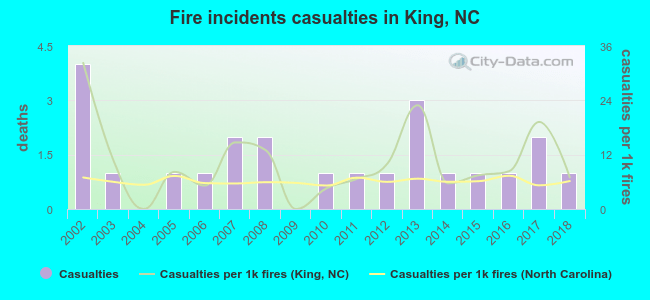 Based on the reports from the years 2002 - 2018 the average number of fire-related casualties per year is 1. The highest number of reported casualties - 4 took place in 2002, and the lowest - 0 in 2004. The data has a dropping trend.
The average number of casualties per 1,000 fires is 10. This indicator was the highest - 32 in 2002, and the lowest 0 in 2004. The trend for injuries per 1,000 incidents is declining. Compared to the state value the number of injuries per 1,000 fires is higher.
Based on the reports from the years 2002 - 2018 the average number of fire-related casualties per year is 1. The highest number of reported casualties - 4 took place in 2002, and the lowest - 0 in 2004. The data has a dropping trend.
The average number of casualties per 1,000 fires is 10. This indicator was the highest - 32 in 2002, and the lowest 0 in 2004. The trend for injuries per 1,000 incidents is declining. Compared to the state value the number of injuries per 1,000 fires is higher.Casualties per 1,000 incidents in King, NC compared to nearest cities:
(Note: Based on data for all years, including only cities with at least 500 fire incidents)
| King: | 9.7 |
| Rural Hall: | 7.0 |
| Pinnacle: | 1.1 |
| East Bend: | 2.5 |
| Pilot Mountain: | 5.0 |
| Walnut Cove: | 1.9 |
| Lewisville: | 5.6 |
| Winston-Salem: | 14.9 |
| Walkertown: | 5.9 |
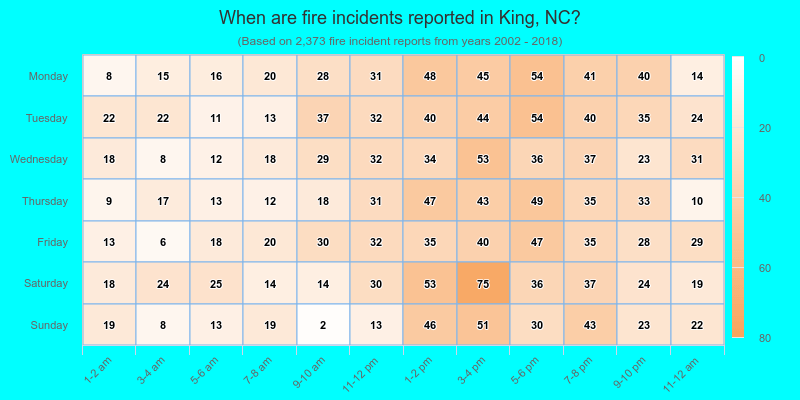
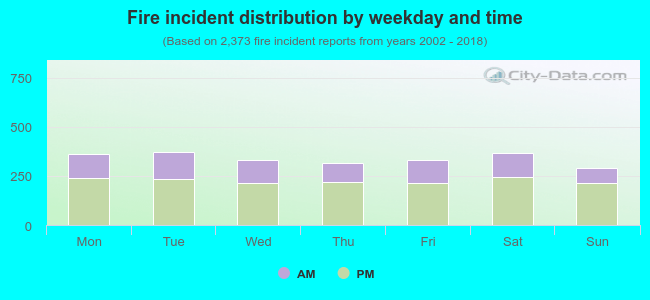 33.3% incidents where reported in the morning and 66.7% in the evening. The most fires (15.8%) took place on Tuesday, and the least (12.2%) on Sunday.
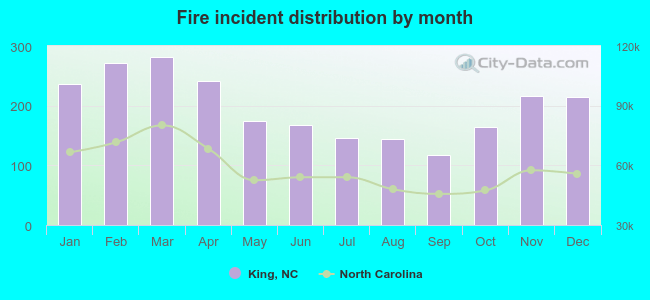 Based on the 2,373 fire incident reports from years 2002 - 2018 most fires (11.8%) took place during March, and the least (5.0%) in September.
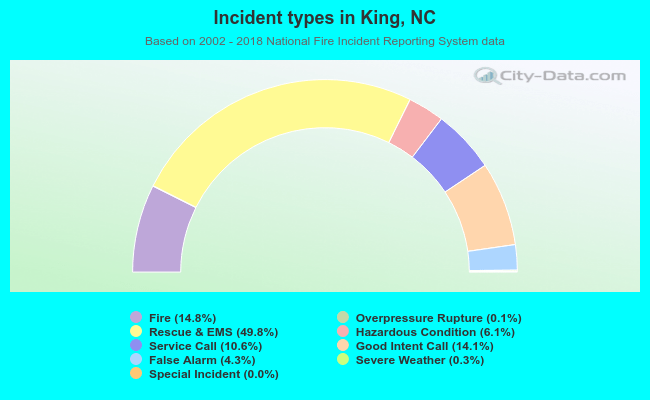 Out of all 16,083 cases reported during the years 2002 - 2018, the most belonged to the categories: Rescue & EMS (49.8%), Fire (14.8%), and Good Intent Call (14.1%).
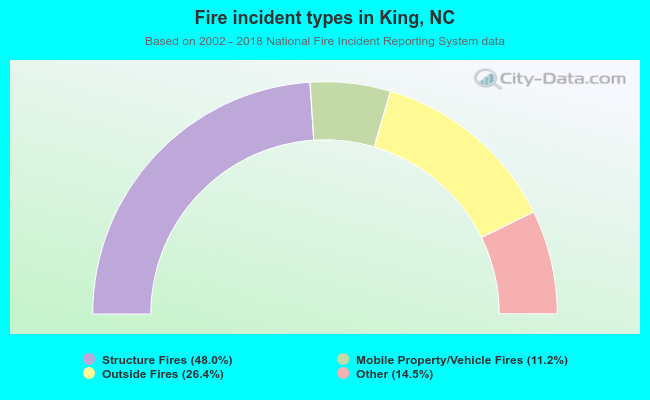 When looking into fire subcategories, the most incidents belonged to: Structure Fires (48.0%), and Outside Fires (26.4%).