Jackson: Fire Incidents, Ohio (OH)
Where are fire incidents reported in Jackson, OH
Something went wrong! Please refresh the page.
| Fire incidents reported | |
|---|---|
| Sreet name | Count |
| MAIN ST | 168 |
| PATTONSVILLE RD | 94 |
| JISCO WEST RD | 70 |
| LIMERICK RD | 68 |
| ST RT 93 | 68 |
| BEAVER PIKE | 64 |
| BROADWAY ST | 60 |
| CHILLICOTHE PIKE | 58 |
| DIXON RUN RD | 46 |
| FOUR MILE RD | 40 |
| BEAVER PIKE | 34 |
| ST RT 139 | 34 |
| ST RT 35 | 34 |
| ATHENS ST | 32 |
| HANLEY RD | 32 |
| MORTON ST | 28 |
| S.R. 776 S.R. | 28 |
| S.R.327 RT | 28 |
| SR 776 | 28 |
| ST RT 93 HWY | 28 |
| WHALEYTOWN RD | 28 |
| BETHEL RIDGE RD | 26 |
| HURON ST | 26 |
| KEYSTONE FURNACE RD | 26 |
| ST RT 32 | 26 |
| ST RT 788 | 26 |
| VALLEY CHAPEL RD | 26 |
| DAVID AVE | 24 |
| FAIRGREENS RD | 24 |
| FIVE POINTS RD | 24 |
| Other | 682 |
2002 - 2018 National Fire Incident Reporting System (NFIRS) incidents
- Incident types reported to NFIRS in Jackson, OH
- 1,98046.3%Fire
- 1,03624.2%Hazardous Condition
- 63014.7%Rescue & EMS
- 3067.2%Good Intent Call
- 1904.4%Service Call
- 1092.6%False Alarm
- 100.2%Special Incident
- 70.2%Severe Weather
- 50.1%Overpressure Rupture
- Fire incident types reported to NFIRS in Jackson, OH
- 98249.6%Structure Fires
- 63732.2%Outside Fires
- 35117.7%Mobile Property/Vehicle Fires
- 100.5%Other
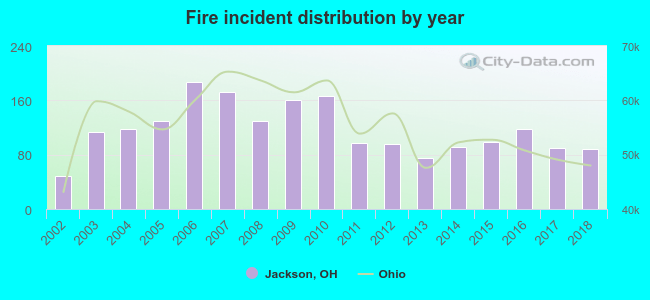 Based on the data from the years 2002 - 2018 the average number of fires per year is 116. The highest number of fire incidents - 187 took place in 2006, and the least - 48 in 2002. The data has a rising trend.
The average number of yearly fire incidents per 10k residents in Jackson, OH compared to nearest cities:
(Note: Based on data for the last 3 years, including only cities with population 5,000 and above)
| Jackson: | 157.0 |
| Wellston: | 137.3 |
| Wheelersburg: | 76.1 |
| Chillicothe: | 128.5 |
| Portsmouth: | 82.0 |
| Athens: | 45.9 |
| Nelsonville: | 95.3 |
| Logan: | 104.8 |
| Ironton: | 85.2 |
 The median response time based on all reported fire incidents is 10 minutes. This is higher than the state median value.
The median response time in Jackson, OH compared to nearest cities:
(Note: Based on data for all years, including only cities with at least 500 fire incidents)
| Jackson: | 10 minutes |
| Wellston: | 7 minutes |
| Beaver: | 15 minutes |
| Oak Hill: | 11 minutes |
| McArthur: | 11 minutes |
| South Webster: | 11 minutes |
| Minford: | 11 minutes |
| Piketon: | 16 minutes |
| Lucasville: | 12 minutes |
 According to the data from the years 2002 - 2018 the average number of fire-related yearly deaths is 0. The highest number of reported deaths - 1 took place in 2004, and the lowest - 0 in 2002. The data has a rising trend.
 According to the reports from the years 2002 - 2018 the average number of fire-related yearly casualties is 2. The highest number of reported casualties - 6 took place in 2014, and the lowest - 0 in 2002. The data has a growing trend.
The average number of injuries per 1,000 fires is 18. This indicator was the highest - 65 in 2014, and the lowest 0 in 2002. The trend for injuries per 1,000 incidents is increasing. Compared to the Ohio value the number of casualties per 1,000 incidents is about the same.
According to the reports from the years 2002 - 2018 the average number of fire-related yearly casualties is 2. The highest number of reported casualties - 6 took place in 2014, and the lowest - 0 in 2002. The data has a growing trend.
The average number of injuries per 1,000 fires is 18. This indicator was the highest - 65 in 2014, and the lowest 0 in 2002. The trend for injuries per 1,000 incidents is increasing. Compared to the Ohio value the number of casualties per 1,000 incidents is about the same.Casualties per 1,000 incidents in Jackson, OH compared to nearest cities:
(Note: Based on data for all years, including only cities with at least 500 fire incidents)
| Jackson: | 16.2 |
| Wellston: | 21.4 |
| Beaver: | 1.4 |
| Oak Hill: | 7.6 |
| McArthur: | 5.0 |
| South Webster: | 0.0 |
| Minford: | 0.0 |
| Piketon: | 3.7 |
| Lucasville: | 4.2 |
 31.7% incidents where reported in the morning and 68.3% in the evening. The most fires (15.6%) took place on Thursday, and the least (13.1%) on Sunday.
 According to the 1,980 reports from years 2002 - 2018 most fires (12.6%) took place during April, and the least (6.2%) in August.
 Out of all 4,273 cases reported during the years 2002 - 2018, the most belonged to the categories: Fire (46.3%), Hazardous Condition (24.2%), and Rescue & EMS (14.7%).
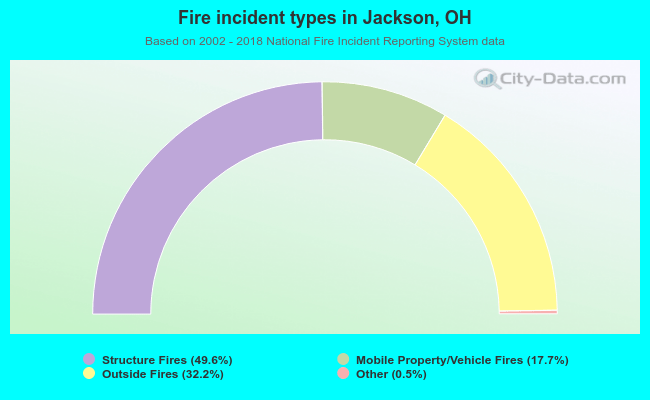 When looking into fire subcategories, the most reports belonged to: Structure Fires (49.6%), and Outside Fires (32.2%).