Chillicothe: Fire Incidents, Ohio (OH)
Where are fire incidents reported in Chillicothe, OH
Something went wrong! Please refresh the page.
| Fire incidents reported | |
|---|---|
| Sreet name | Count |
| BRIDGE ST | 298 |
| MAIN ST | 164 |
| CHARLSTON PIKE | 138 |
| PAINT ST | 118 |
| WATER ST | 100 |
| WESTERN AVE | 98 |
| SR 772 RT | 92 |
| LIBERTY HILL RD | 76 |
| US RT 23 | 72 |
| CHARLESTON PIKE | 68 |
| US RT 50 | 68 |
| 2ND ST | 66 |
| BLACK RUN RD | 66 |
| 4TH ST | 64 |
| MASSIEVILLE RD | 64 |
| BLAIN HWY | 62 |
| HIGH ST | 62 |
| EGYPT PIKE | 56 |
| STONE RD | 56 |
| US 23 HWY | 54 |
| WALNUT ST | 54 |
| MARIETTA RD | 52 |
| PLEASANT VALLEY RD | 52 |
| TREGO CREEK RD | 50 |
| ST RT 772 | 46 |
| THREE LOCKS RD | 46 |
| WINDY RIDGE RD | 46 |
| 5TH ST | 42 |
| ROZELLE CREEK RD | 42 |
| SECOND ST | 40 |
| Other | 2,516 |
2002 - 2018 National Fire Incident Reporting System (NFIRS) incidents
- Incident types reported to NFIRS in Chillicothe, OH
- 4,82839.4%Fire
- 2,40719.6%Rescue & EMS
- 2,37619.4%Hazardous Condition
- 9908.1%False Alarm
- 9868.0%Service Call
- 5274.3%Good Intent Call
- 580.5%Special Incident
- 420.3%Overpressure Rupture
- 420.3%Severe Weather
- Fire incident types reported to NFIRS in Chillicothe, OH
- 2,06742.8%Structure Fires
- 1,87638.9%Outside Fires
- 85517.7%Mobile Property/Vehicle Fires
- 300.6%Other
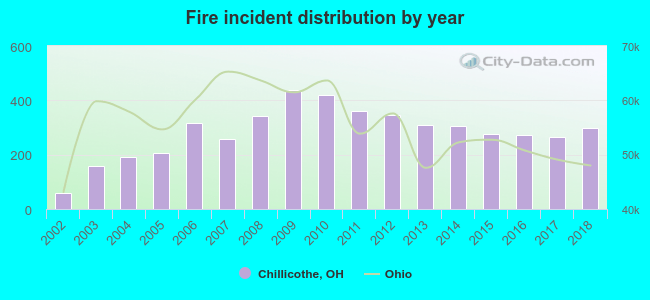 According to the data from the years 2002 - 2018 the average number of fire incidents per year is 284. The highest number of reported fire incidents - 437 took place in 2009, and the least - 58 in 2002. The data has a growing trend.
The average number of yearly fire incidents per 10k residents in Chillicothe, OH compared to nearest cities:
(Note: Based on data for the last 3 years, including only cities with population 5,000 and above)
| Chillicothe: | 128.5 |
| Circleville: | 47.1 |
| Jackson: | 157.0 |
| Wellston: | 137.3 |
| Lancaster: | 65.3 |
| Logan: | 104.8 |
| Hillsboro: | 158.8 |
| Groveport: | 111.7 |
| Canal Winchester: | 90.9 |
 The median response time based on all reported fire incidents is 9 minutes. This is higher compared to the state median value.
The median response time in Chillicothe, OH compared to nearest cities:
(Note: Based on data for all years, including only cities with at least 500 fire incidents)
| Chillicothe: | 9 minutes |
| Laurelville: | 11 minutes |
| Circleville: | 9 minutes |
| Piketon: | 16 minutes |
| Greenfield: | 8 minutes |
| Beaver: | 15 minutes |
| Amanda: | 13 minutes |
| Ashville: | 9 minutes |
| Jackson: | 10 minutes |
 Based on the reports from the years 2002 - 2018 the average number of fire-related yearly deaths is 1. The highest number of reported deaths - 3 took place in 2009, and the lowest - 0 in 2002. The data has a constant trend.
The average number of fatalities per 1,000 fires is 2. This indicator was the highest - 8 in 2017, and the lowest 0 in 2002. The trend for fatalities per 1,000 fire incidents is increasing. Compared to the Ohio value the number of deaths per 1,000 fire incidents is higher.
Based on the reports from the years 2002 - 2018 the average number of fire-related yearly deaths is 1. The highest number of reported deaths - 3 took place in 2009, and the lowest - 0 in 2002. The data has a constant trend.
The average number of fatalities per 1,000 fires is 2. This indicator was the highest - 8 in 2017, and the lowest 0 in 2002. The trend for fatalities per 1,000 fire incidents is increasing. Compared to the Ohio value the number of deaths per 1,000 fire incidents is higher.
 Based on the data from the years 2002 - 2018 the average number of fire-related yearly casualties is 3. The highest number of reported casualties - 12 took place in 2010, and the lowest - 0 in 2002. The data has an increasing trend.
The average number of casualties per 1,000 fire incidents is 8. This indicator was the highest - 29 in 2010, and the lowest 0 in 2002. The trend for injuries per 1,000 incidents is increasing. Compared to the Ohio value the number of casualties per 1,000 fire incidents is lower.
Based on the data from the years 2002 - 2018 the average number of fire-related yearly casualties is 3. The highest number of reported casualties - 12 took place in 2010, and the lowest - 0 in 2002. The data has an increasing trend.
The average number of casualties per 1,000 fire incidents is 8. This indicator was the highest - 29 in 2010, and the lowest 0 in 2002. The trend for injuries per 1,000 incidents is increasing. Compared to the Ohio value the number of casualties per 1,000 fire incidents is lower.Casualties per 1,000 incidents in Chillicothe, OH compared to nearest cities:
(Note: Based on data for all years, including only cities with at least 500 fire incidents)
| Chillicothe: | 9.5 |
| Laurelville: | 0.0 |
| Circleville: | 6.0 |
| Piketon: | 3.7 |
| Greenfield: | 9.3 |
| Beaver: | 1.4 |
| Amanda: | 0.0 |
| Ashville: | 1.3 |
| Jackson: | 16.2 |
 31.4% incidents where reported in the morning and 68.6% in the evening. The most fires (15.9%) took place on Sunday, and the least (13.3%) on Tuesday.
 According to the 4,828 incident reports from years 2002 - 2018 most fires (11.3%) took place during April, and the least (6.5%) in January.
 Out of all 12,256 cases reported during the years 2002 - 2018, the most belonged to the categories: Fire (39.4%), Rescue & EMS (19.6%), and Hazardous Condition (19.4%).
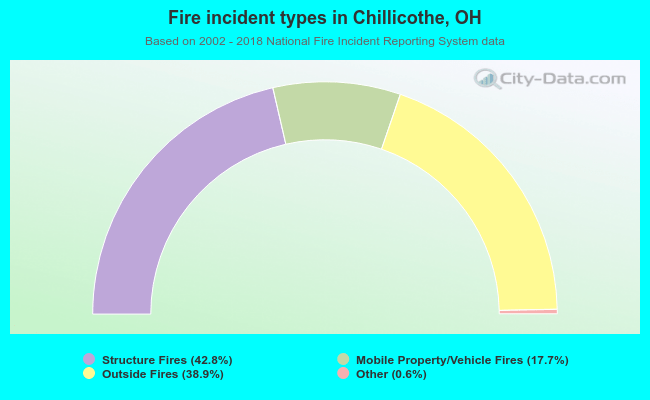 When looking into fire subcategories, the most reports belonged to: Structure Fires (42.8%), and Outside Fires (38.9%).