Islip: Fire Incidents, New York (NY)
Where are fire incidents reported in Islip, NY
Something went wrong! Please refresh the page.
|
| |||||||||||||||||||||||||||||||||||||||||||||||||||||||||||||||||||||||||||||||||||||||||||||||||||||||||||||
2003 - 2018 National Fire Incident Reporting System (NFIRS) incidents
- Incident types reported to NFIRS in Islip, NY
- 2,23959.4%Rescue & EMS
- 66217.6%Good Intent Call
- 43511.5%False Alarm
- 2125.6%Hazardous Condition
- 1183.1%Fire
- 902.4%Service Call
- 50.1%Special Incident
- 40.1%Overpressure Rupture
- Fire incident types reported to NFIRS in Islip, NY
- 8874.6%Structure Fires
- 1815.3%Outside Fires
- 97.6%Mobile Property/Vehicle Fires
- 32.5%Other
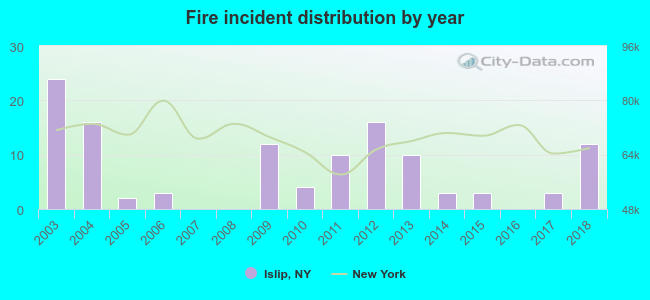 Based on the data from the years 2003 - 2018 the average number of fire incidents per year is 7. The highest number of fires - 24 took place in 2003, and the least - 0 in 2007. The data has a declining trend.
The average number of yearly fire incidents per 10k residents in Islip, NY compared to nearest cities:
(Note: Based on data for the last 3 years, including only cities with population 5,000 and above)
| Islip: | 4.0 |
| East Islip: | 6.9 |
| Bay Shore: | 44.6 |
| Islip Terrace: | 14.2 |
| Brentwood: | 21.8 |
| Central Islip: | 27.4 |
| Oakdale: | 31.4 |
| West Islip: | 11.9 |
| North Babylon: | 1.5 |
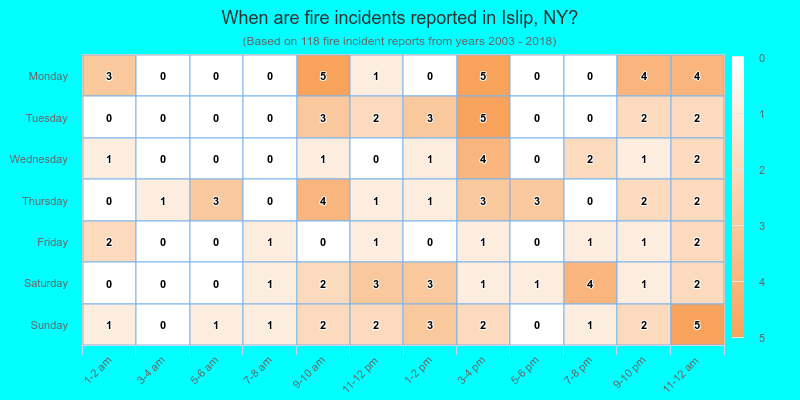
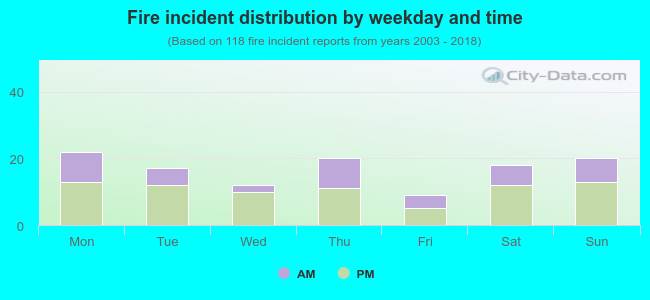 35.6% incidents where reported in the morning and 64.4% in the evening. The most fires (18.6%) took place on Monday, and the least (7.6%) on Friday.
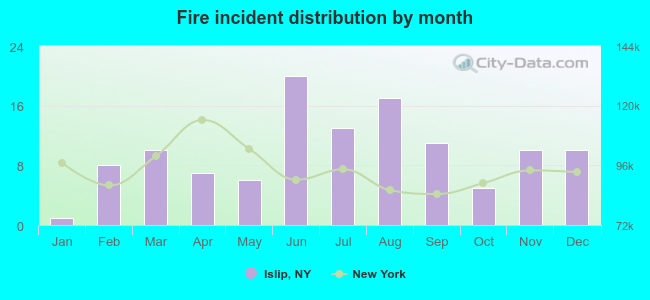 Based on the 118 fire incident reports from years 2003 - 2018 most fires (16.9%) took place during June, and the least (0.8%) in January.
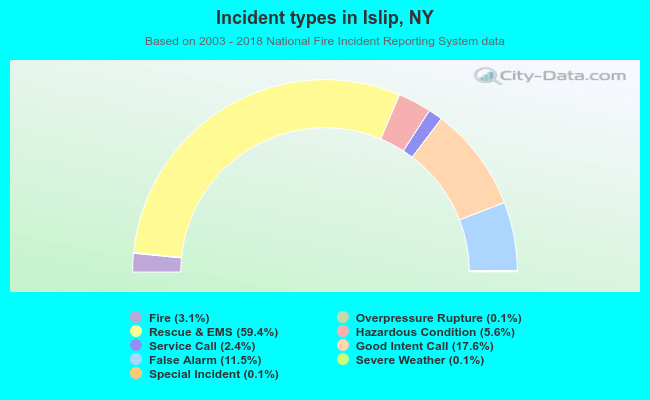 Out of all 3,767 cases reported during the years 2003 - 2018, the most belonged to the categories: Rescue & EMS (59.4%), Good Intent Call (17.6%), and False Alarm (11.5%).
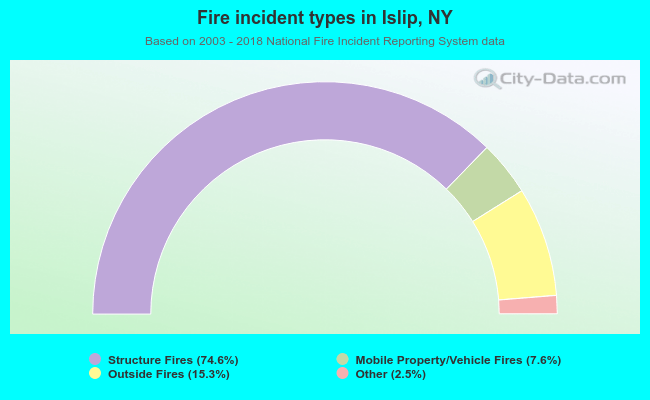 When looking into fire subcategories, the most incidents belonged to: Structure Fires (74.6%), and Outside Fires (15.3%).