Central Islip: Fire Incidents, New York (NY)
Where are fire incidents reported in Central Islip, NY
Something went wrong! Please refresh the page.
|
| |||||||||||||||||||||||||||||||||||||||||||||||||||||||||||||||||||||||||||||||||||||||||||||||||||||||||||||
| Other | 10 | |||||||||||||||||||||||||||||||||||||||||||||||||||||||||||||||||||||||||||||||||||||||||||||||||||||||||||||
2003 - 2018 National Fire Incident Reporting System (NFIRS) incidents
- Incident types reported to NFIRS in Central Islip, NY
- 1,57432.1%Hazardous Condition
- 1,16423.7%False Alarm
- 62012.6%Good Intent Call
- 58211.9%Fire
- 57011.6%Rescue & EMS
- 3176.5%Service Call
- 471.0%Severe Weather
- 220.4%Special Incident
- 150.3%Overpressure Rupture
- Fire incident types reported to NFIRS in Central Islip, NY
- 47681.8%Structure Fires
- 9416.2%Outside Fires
- 71.2%Mobile Property/Vehicle Fires
- 50.9%Other
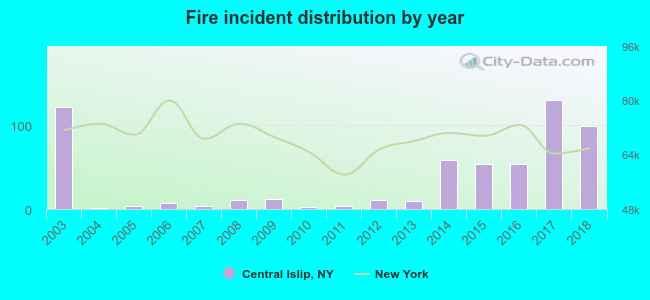 Based on the data from the years 2003 - 2018 the average number of fire incidents per year is 36. The highest number of fires - 130 took place in 2017, and the least - 1 in 2004. The data has a decreasing trend.
The average number of yearly fire incidents per 10k residents in Central Islip, NY compared to nearest cities:
(Note: Based on data for the last 3 years, including only cities with population 5,000 and above)
| Central Islip: | 27.4 |
| Brentwood: | 21.8 |
| Hauppauge: | 30.2 |
| Islip Terrace: | 14.2 |
| Islip: | 4.0 |
| East Islip: | 6.9 |
| Ronkonkoma: | 43.0 |
| Oakdale: | 31.4 |
| Bohemia: | 32.1 |
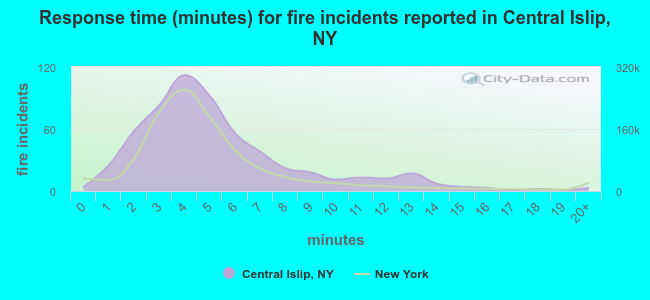 The median response time based on all reported fire incidents is 5 minutes. This is higher compared to the state median value.
The median response time in Central Islip, NY compared to nearest cities:
(Note: Based on data for all years, including only cities with at least 500 fire incidents)
| Central Islip: | 5 minutes |
| Brentwood: | 6 minutes |
| Hauppauge: | 4 minutes |
| Ronkonkoma: | 6 minutes |
| Bohemia: | 4 minutes |
| Bay Shore: | 4 minutes |
| Smithtown: | 6 minutes |
| Commack: | 5 minutes |
| Holbrook: | 4 minutes |
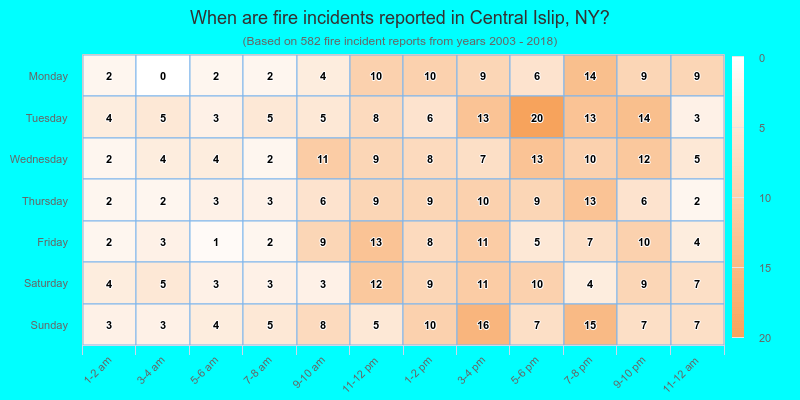
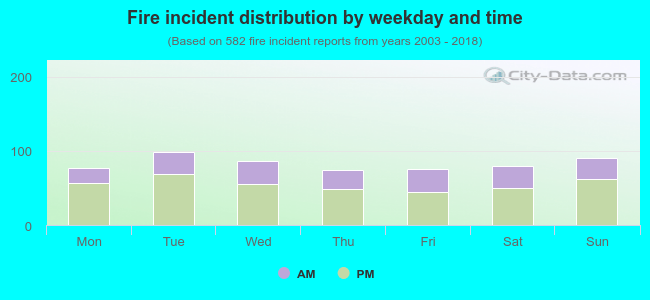 33.5% incidents where reported in the morning and 66.5% in the evening. The most fires (17.0%) took place on Tuesday, and the least (12.7%) on Thursday.
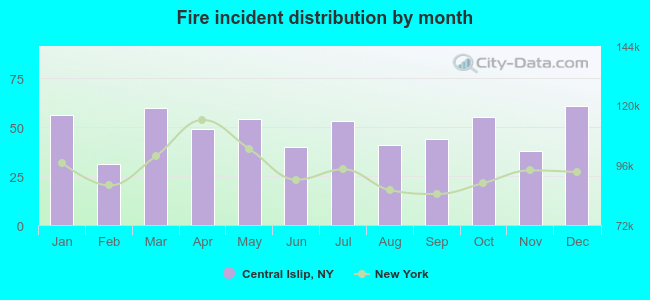 According to the 582 incident reports from years 2003 - 2018 most fires (10.5%) took place during December, and the least (5.3%) in February.
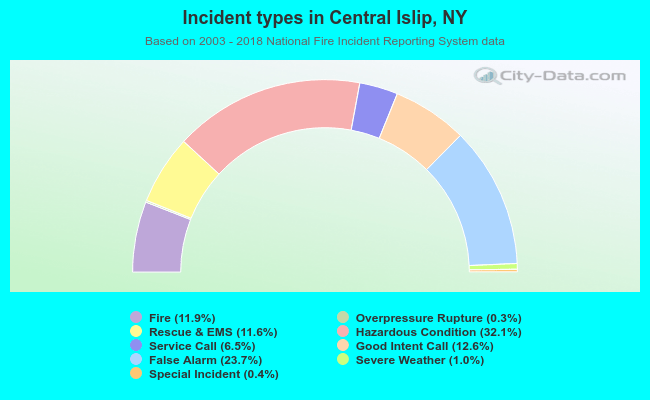 Out of all 4,911 cases reported during the years 2003 - 2018, the most belonged to the categories: Hazardous Condition (32.1%), False Alarm (23.7%), and Good Intent Call (12.6%).
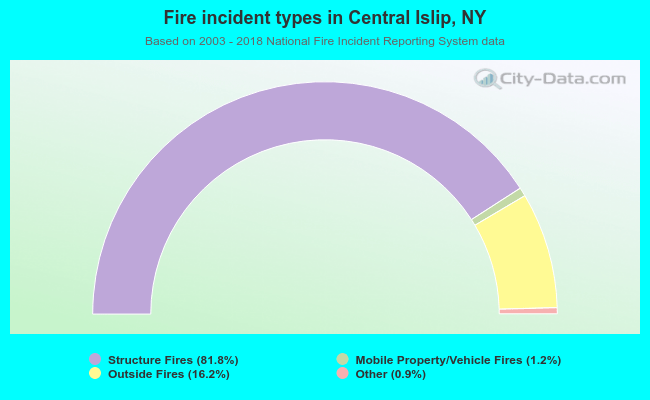 When looking into fire subcategories, the most reports belonged to: Structure Fires (81.8%), and Outside Fires (16.2%).