Horn Lake: Fire Incidents, Mississippi (MS)
Where are fire incidents reported in Horn Lake, MS
Something went wrong! Please refresh the page.
| Fire incidents reported | |
|---|---|
| Sreet name | Count |
| GOODMAN RD | 332 |
| TULANE RD | 174 |
| NAIL RD | 84 |
| 51 HWY | 82 |
| CHURCH RD | 66 |
| GOODMAN | 56 |
| HORN LAKE RD | 54 |
| INTERSTATE BLVD | 38 |
| 301 HWY | 36 |
| HURT RD | 34 |
| DESOTO CV | 28 |
| NORMANDY DR | 28 |
| DUNBARTON DR | 26 |
| MALLARD CREEK DR | 26 |
| SHADOW OAKS PKY | 26 |
| SUTTON PLACE DR | 26 |
| CARROLL DR | 24 |
| CAROLINE DR | 22 |
| CHEROKEE DR | 22 |
| TULANE | 22 |
| HWY 51 | 20 |
| JOY CIR | 20 |
| MAYFAIR DR | 20 |
| TEALWOOD DR | 20 |
| CHOCTAW DR | 18 |
| COLE RD | 18 |
| HAMPTON DR | 18 |
| 302 HWY | 16 |
| BRIGHTON DR | 16 |
| GREENWAY DR | 16 |
| Other | 331 |
2002 - 2018 National Fire Incident Reporting System (NFIRS) incidents
- Incident types reported to NFIRS in Horn Lake, MS
- 4,78849.7%Rescue & EMS
- 1,71917.8%Fire
- 1,24812.9%Hazardous Condition
- 9409.8%False Alarm
- 7027.3%Service Call
- 1811.9%Good Intent Call
- 340.4%Overpressure Rupture
- 220.2%Severe Weather
- Fire incident types reported to NFIRS in Horn Lake, MS
- 75844.1%Structure Fires
- 65638.2%Outside Fires
- 28616.6%Mobile Property/Vehicle Fires
- 191.1%Other
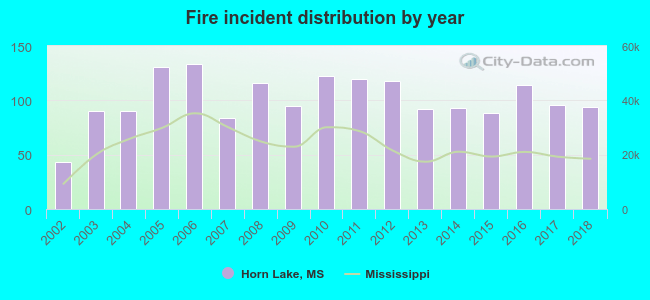 Based on the data from the years 2002 - 2018 the average number of fires per year is 101. The highest number of reported fires - 133 took place in 2006, and the least - 43 in 2002. The data has a rising trend.
The average number of yearly fire incidents per 10k residents in Horn Lake, MS compared to nearest cities:
(Note: Based on data for the last 3 years, including only cities with population 5,000 and above)
| Horn Lake: | 37.9 |
| Southaven: | 30.0 |
| Hernando: | 104.2 |
| Olive Branch: | 52.0 |
| Senatobia: | 158.1 |
| Holly Springs: | 220.9 |
| Batesville: | 247.3 |
 The median response time based on all reported fire incidents is 4 minutes. This is lower compared to the Mississippi median value.
The median response time in Horn Lake, MS compared to nearest cities:
(Note: Based on data for all years, including only cities with at least 500 fire incidents)
| Horn Lake: | 4 minutes |
| Southaven: | 5 minutes |
| Walls: | 8 minutes |
| Hernando: | 8 minutes |
| Olive Branch: | 6 minutes |
| West Memphis: | 5 minutes |
| Coldwater: | 10 minutes |
| Marion: | 7 minutes |
| Byhalia: | 12 minutes |
 Based on the data from the years 2002 - 2018 the average number of fire-related fatalities per year is 0. The highest number of deaths - 2 took place in 2009, and the lowest - 0 in 2002. The data has a growing trend.
 Based on the data from the years 2002 - 2018 the average number of fire-related yearly casualties is 2. The highest number of casualties - 8 took place in 2018, and the lowest - 0 in 2002. The data has a growing trend.
The average number of casualties per 1,000 fire incidents is 21. This indicator was the highest - 85 in 2018, and the lowest 0 in 2002. The trend for injuries per 1,000 incidents is growing. Compared to the state value the number of casualties per 1,000 fire incidents is much higher.
Based on the data from the years 2002 - 2018 the average number of fire-related yearly casualties is 2. The highest number of casualties - 8 took place in 2018, and the lowest - 0 in 2002. The data has a growing trend.
The average number of casualties per 1,000 fire incidents is 21. This indicator was the highest - 85 in 2018, and the lowest 0 in 2002. The trend for injuries per 1,000 incidents is growing. Compared to the state value the number of casualties per 1,000 fire incidents is much higher.Casualties per 1,000 incidents in Horn Lake, MS compared to nearest cities:
(Note: Based on data for all years, including only cities with at least 500 fire incidents)
| Horn Lake: | 21.5 |
| Southaven: | 17.6 |
| Walls: | 2.9 |
| Hernando: | 3.2 |
| Olive Branch: | 2.8 |
| West Memphis: | 8.2 |
| Coldwater: | 5.1 |
| Marion: | 0.0 |
| Byhalia: | 1.7 |
 29.6% incidents where reported in the morning and 70.4% in the evening. The most fires (16.6%) took place on Sunday, and the least (12.8%) on Thursday.
 According to the 1,719 reports from years 2002 - 2018 most fires (10.9%) took place during January, and the least (6.1%) in June.
 Out of all 9,641 cases reported during the years 2002 - 2018, the most belonged to the categories: Rescue & EMS (49.7%), Fire (17.8%), and Hazardous Condition (12.9%).
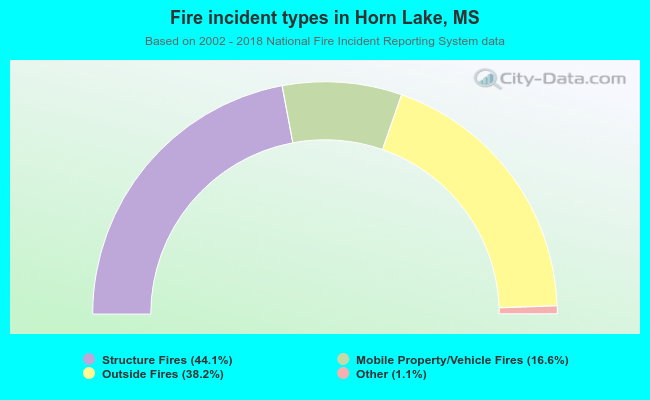 When looking into fire subcategories, the most reports belonged to: Structure Fires (44.1%), and Outside Fires (38.2%).