Marion: Fire Incidents, Arkansas (AR)
Where are fire incidents reported in Marion, AR
Something went wrong! Please refresh the page.
|
| |||||||||||||||||||||||||||||||||||||||||||||||||||||||||||||||||||||||||||||||||||||||||||||||||||||||||||||
| Other | 653 | |||||||||||||||||||||||||||||||||||||||||||||||||||||||||||||||||||||||||||||||||||||||||||||||||||||||||||||
2003 - 2018 National Fire Incident Reporting System (NFIRS) incidents
- Incident types reported to NFIRS in Marion, AR
- 1,19740.8%Fire
- 83528.5%Rescue & EMS
- 35312.0%Good Intent Call
- 2618.9%False Alarm
- 2428.2%Hazardous Condition
- 321.1%Service Call
- 100.3%Overpressure Rupture
- 30.1%Severe Weather
- Fire incident types reported to NFIRS in Marion, AR
- 51543.0%Outside Fires
- 43536.3%Structure Fires
- 19416.2%Mobile Property/Vehicle Fires
- 534.4%Other
 Based on the data from the years 2003 - 2018 the average number of fires per year is 75. The highest number of reported fires - 125 took place in 2016, and the least - 2 in 2009. The data has a growing trend.
The average number of yearly fire incidents per 10k residents in Marion, AR compared to nearest cities:
(Note: Based on data for the last 3 years, including only cities with population 5,000 and above)
| Marion: | 83.3 |
| West Memphis: | 88.5 |
| Wynne: | 121.5 |
| Forrest City: | 64.1 |
| Osceola: | 81.5 |
| Trumann: | 173.6 |
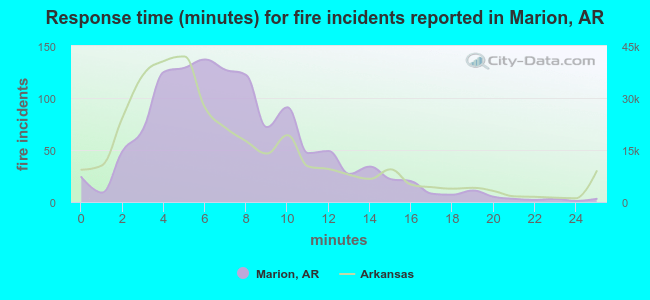 The median response time based on all reported fire incidents is 7 minutes. This is about the same as the state median value.
The median response time in Marion, AR compared to nearest cities:
(Note: Based on data for all years, including only cities with at least 500 fire incidents)
| Marion: | 7 minutes |
| West Memphis: | 5 minutes |
| Earle: | 5 minutes |
| Hughes: | 5 minutes |
| Marked Tree: | 6 minutes |
| Wynne: | 4 minutes |
| Forrest City: | 4 minutes |
| Osceola: | 3 minutes |
| Trumann: | 3 minutes |
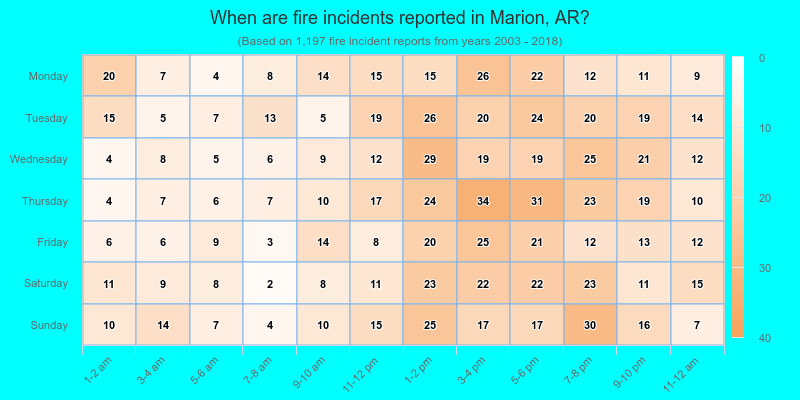
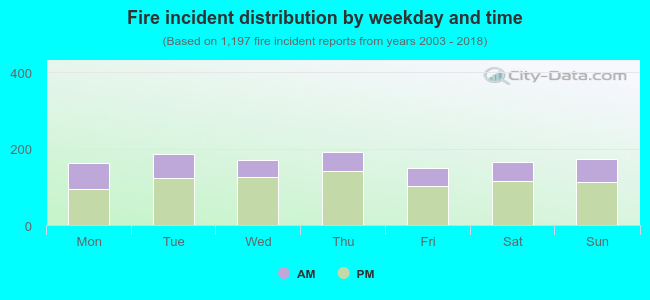 31.9% incidents where reported in the morning and 68.1% in the evening. The most fires (16.0%) took place on Thursday, and the least (12.4%) on Friday.
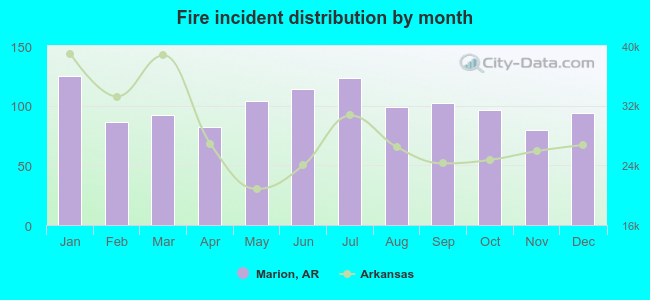 According to the 1,197 fire incidents from years 2003 - 2018 most fires (10.4%) took place during January, and the least (6.7%) in November.
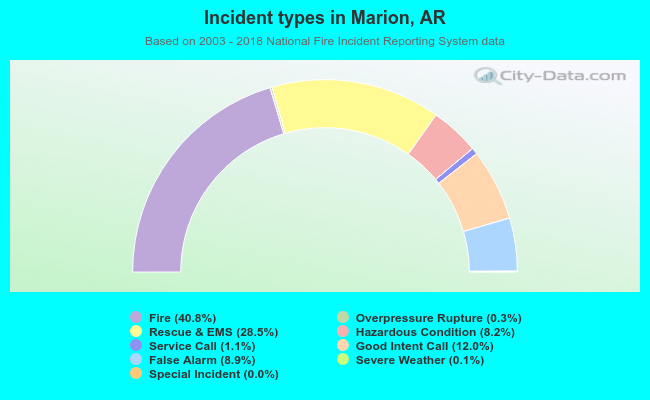 Out of all 2,934 cases reported during the years 2003 - 2018, the most belonged to the categories: Fire (40.8%), Rescue & EMS (28.5%), and Good Intent Call (12.0%).
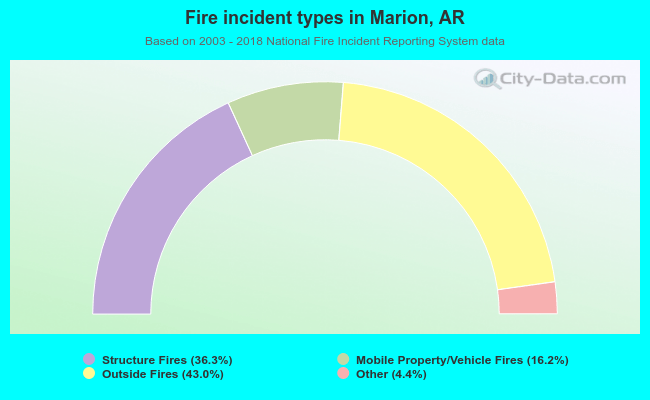 When looking into fire subcategories, the most reports belonged to: Outside Fires (43.0%), and Structure Fires (36.3%).