Hood River: Fire Incidents, Oregon (OR)
Where are fire incidents reported in Hood River, OR
Something went wrong! Please refresh the page.
|
| |||||||||||||||||||||||||||||||||||||||||||||||||||||||||||||||||||||||||||||||||||||||||||||||||||||||||||||
| Other | 426 | |||||||||||||||||||||||||||||||||||||||||||||||||||||||||||||||||||||||||||||||||||||||||||||||||||||||||||||
2002 - 2018 National Fire Incident Reporting System (NFIRS) incidents
- Incident types reported to NFIRS in Hood River, OR
- 4,18857.1%Rescue & EMS
- 1,47020.0%Fire
- 6899.4%Good Intent Call
- 4075.6%Service Call
- 2873.9%Hazardous Condition
- 2453.3%False Alarm
- 340.5%Special Incident
- 100.1%Overpressure Rupture
- Fire incident types reported to NFIRS in Hood River, OR
- 65244.4%Structure Fires
- 55137.5%Outside Fires
- 17712.0%Mobile Property/Vehicle Fires
- 906.1%Other
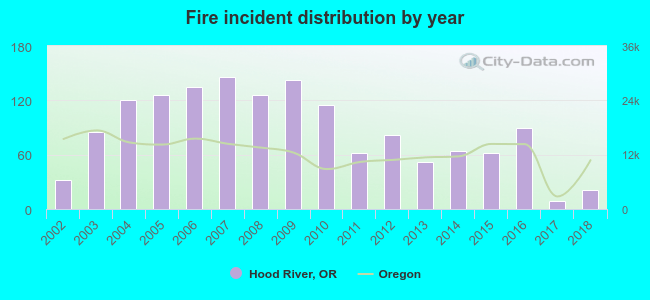 According to the data from the years 2002 - 2018 the average number of fires per year is 86. The highest number of reported fire incidents - 146 took place in 2007, and the least - 9 in 2017. The data has a dropping trend.
The average number of yearly fire incidents per 10k residents in Hood River, OR compared to nearest cities:
(Note: Based on data for the last 3 years, including only cities with population 5,000 and above)
| Hood River: | 53.5 |
| The Dalles: | 14.9 |
| City of The Dalles: | 38.4 |
| Mount Hood: | 5.2 |
| Sandy: | 30.7 |
| Troutdale: | 9.9 |
| Fairview: | 14.1 |
| Gresham: | 13.1 |
| Damascus: | 13.8 |
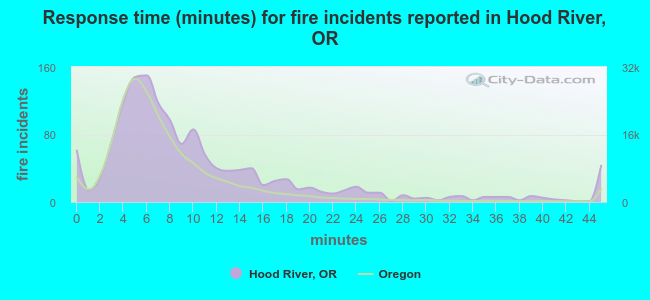 The median response time based on all reported fire incidents is 8 minutes. This is higher compared to the state median value.
The median response time in Hood River, OR compared to nearest cities:
(Note: Based on data for all years, including only cities with at least 500 fire incidents)
| Hood River: | 8 minutes |
| The Dalles: | 8 minutes |
| Sandy: | 8 minutes |
| Troutdale: | 5 minutes |
| Gresham: | 5 minutes |
| Estacada: | 9 minutes |
| Happy Valley: | 5 minutes |
| Clackamas: | 6 minutes |
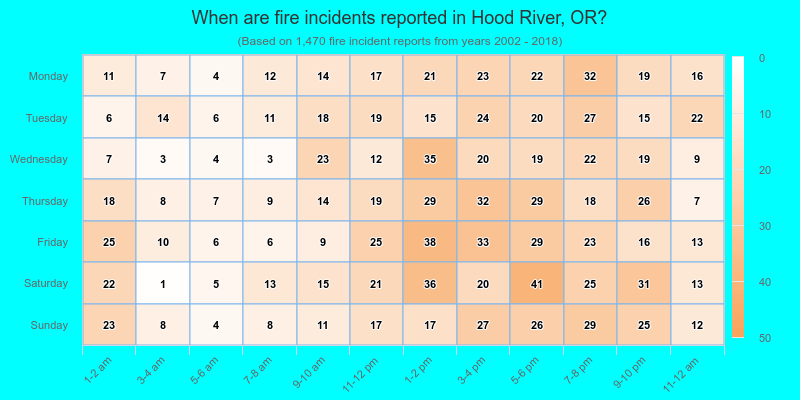
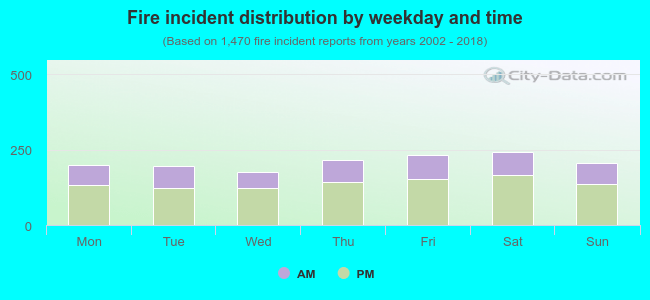 33.7% incidents where reported in the morning and 66.3% in the evening. The most fires (16.5%) took place on Saturday, and the least (12.0%) on Wednesday.
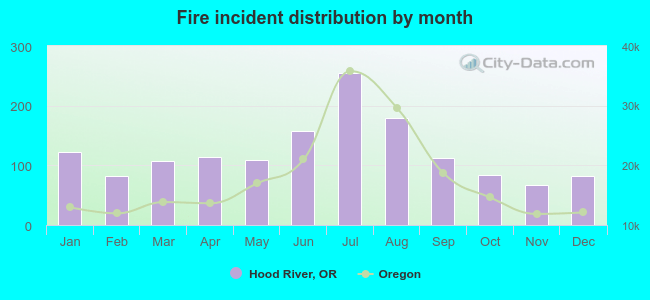 According to the 1,470 incident reports from years 2002 - 2018 most fires (17.3%) took place during July, and the least (4.6%) in November.
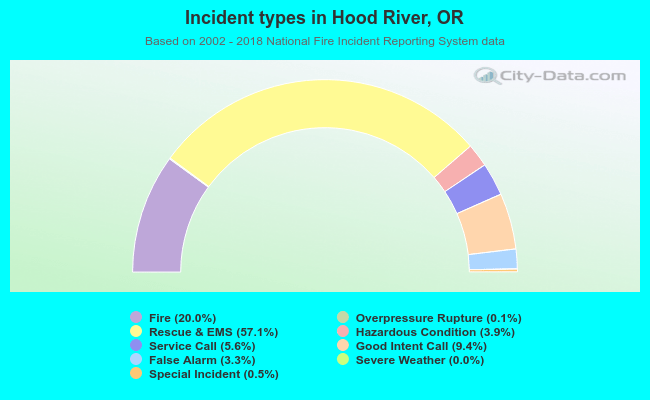 Out of all 7,332 cases reported during the years 2002 - 2018, the most belonged to the categories: Rescue & EMS (57.1%), Fire (20.0%), and Good Intent Call (9.4%).
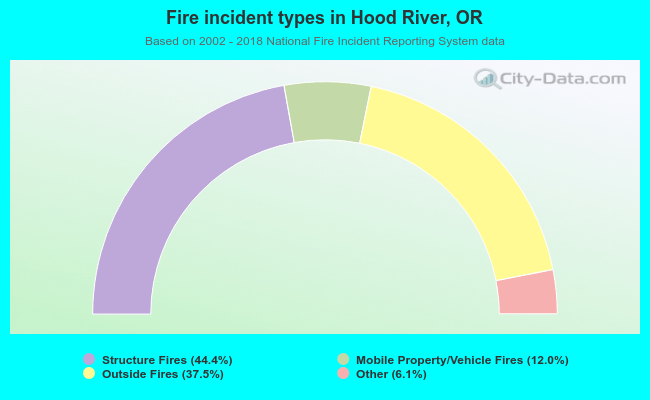 When looking into fire subcategories, the most reports belonged to: Structure Fires (44.4%), and Outside Fires (37.5%).