Fairview: Fire Incidents, Oregon (OR)
Where are fire incidents reported in Fairview, OR
Something went wrong! Please refresh the page.
|
| |||||||||||||||||||||||||||||||||||||||||||||||||||||||||||||||||||||||||||||||||||||||||||||||||||||||||||||
2002 - 2018 National Fire Incident Reporting System (NFIRS) incidents
- Incident types reported to NFIRS in Fairview, OR
- 1,55359.2%Rescue & EMS
- 34313.1%Fire
- 2318.8%Service Call
- 1947.4%Good Intent Call
- 1525.8%False Alarm
- 1465.6%Hazardous Condition
- 30.1%Special Incident
- Fire incident types reported to NFIRS in Fairview, OR
- 13940.5%Outside Fires
- 12035.0%Structure Fires
- 6318.4%Mobile Property/Vehicle Fires
- 216.1%Other
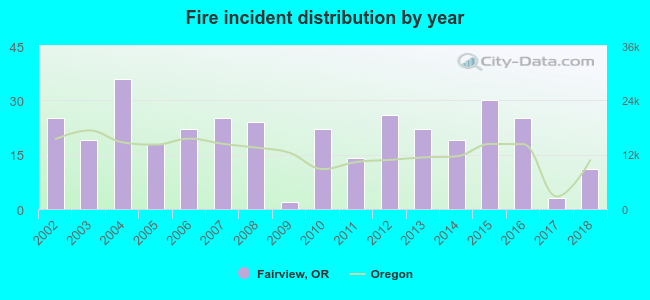 Based on the data from the years 2002 - 2018 the average number of fire incidents per year is 20. The highest number of reported fire incidents - 36 took place in 2004, and the least - 2 in 2009. The data has a decreasing trend.
The average number of yearly fire incidents per 10k residents in Fairview, OR compared to nearest cities:
(Note: Based on data for the last 3 years, including only cities with population 5,000 and above)
| Fairview: | 14.1 |
| Troutdale: | 9.9 |
| Gresham: | 13.1 |
| Happy Valley: | 20.6 |
| Damascus: | 13.8 |
| Portland: | 17.5 |
| Clackamas: | 79.2 |
| Milwaukie: | 31.5 |
| Oak Grove: | 1.6 |

 According to the data from the years 2002 - 2018 the average number of fire-related casualties per year is 1. The highest number of reported casualties - 3 took place in 2008, and the lowest - 0 in 2002. The data has a constant trend.
 32.1% incidents where reported in the morning and 67.9% in the evening. The most fires (18.4%) took place on Sunday, and the least (10.2%) on Thursday.
 According to the 343 fires from years 2002 - 2018 most fires (18.4%) took place during July, and the least (4.1%) in February.
 Out of all 2,624 cases reported during the years 2002 - 2018, the most belonged to the categories: Rescue & EMS (59.2%), Fire (13.1%), and Service Call (8.8%).
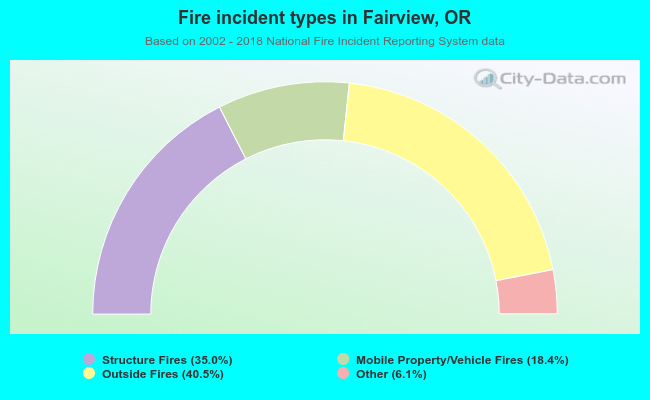 When looking into fire subcategories, the most incidents belonged to: Outside Fires (40.5%), and Structure Fires (35.0%).