Holly Springs: Fire Incidents, Georgia (GA)
Where are fire incidents reported in Holly Springs, GA
Something went wrong! Please refresh the page.
|
| |||||||||||||||||||||||||||||||||||||||||||||||||||||||||||||||||||||||||||||||||||||||||||||||||||||||||||||
2002 - 2018 National Fire Incident Reporting System (NFIRS) incidents
- Incident types reported to NFIRS in Holly Springs, GA
- 3,18857.1%Rescue & EMS
- 59210.6%Good Intent Call
- 5359.6%Hazardous Condition
- 4548.1%Fire
- 4437.9%Service Call
- 3085.5%False Alarm
- 440.8%Special Incident
- 110.2%Overpressure Rupture
- Fire incident types reported to NFIRS in Holly Springs, GA
- 22850.2%Outside Fires
- 11224.7%Structure Fires
- 9420.7%Mobile Property/Vehicle Fires
- 204.4%Other
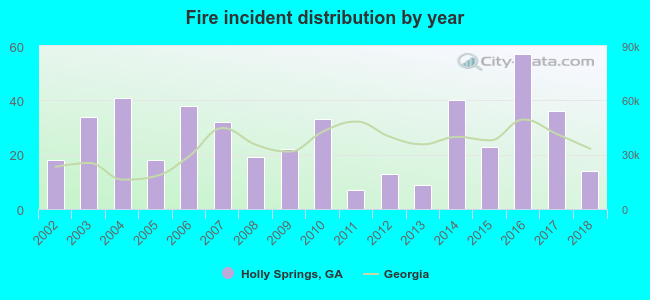 Based on the data from the years 2002 - 2018 the average number of fires per year is 27. The highest number of reported fires - 57 took place in 2016, and the least - 7 in 2011. The data has a declining trend.
The average number of yearly fire incidents per 10k residents in Holly Springs, GA compared to nearest cities:
(Note: Based on data for the last 3 years, including only cities with population 5,000 and above)
| Holly Springs: | 34.8 |
| Canton: | 94.2 |
| Woodstock: | 75.2 |
| Milton: | 24.2 |
| Kennesaw: | 49.7 |
| Acworth: | 85.7 |
| Roswell: | 18.7 |
| Alpharetta: | 29.3 |
| Marietta: | 90.3 |

 25.3% incidents where reported in the morning and 74.7% in the evening. The most fires (17.8%) took place on Friday, and the least (10.6%) on Saturday.
 Based on the 454 incident reports from years 2002 - 2018 most fires (13.2%) took place during March, and the least (4.8%) in May.
 Out of all 5,579 cases reported during the years 2002 - 2018, the most belonged to the categories: Rescue & EMS (57.1%), Good Intent Call (10.6%), and Hazardous Condition (9.6%).
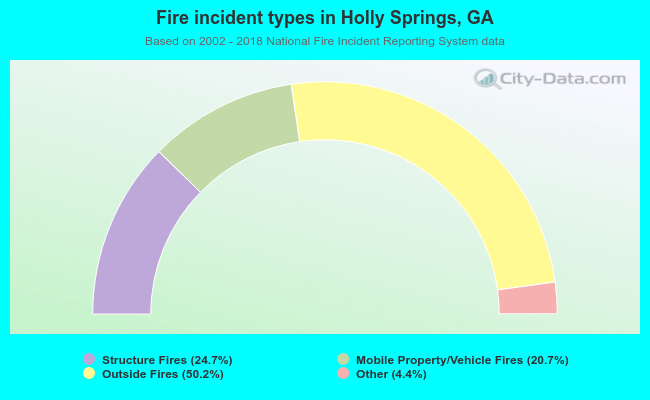 When looking into fire subcategories, the most reports belonged to: Outside Fires (50.2%), and Structure Fires (24.7%).