Alpharetta: Fire Incidents, Georgia (GA)
Where are fire incidents reported in Alpharetta, GA
Something went wrong! Please refresh the page.
| Fire incidents reported | |
|---|---|
| Sreet name | Count |
| ATLANTA HWY | 78 |
| MAIN ST | 76 |
| NORTH POINT PKY | 70 |
| WINDWARD PKWY | 70 |
| GARDNER DR | 68 |
| MCFARLAND PKY | 68 |
| GA 400 | 66 |
| GA400SB | 62 |
| HAYNES BRIDGE RD | 62 |
| MANSELL RD | 62 |
| OLD MILTON PKWY | 58 |
| WEBB BRIDGE RD | 58 |
| GA400NB | 52 |
| WINDWARD PKY | 50 |
| OLD MILTON PKY | 46 |
| TIDWELL RD | 46 |
| NORTH POINT CIR | 44 |
| NORTH POINT | 42 |
| GA400 | 40 |
| NORTH POINT PKWY | 38 |
| OLD MILTON | 38 |
| SHILOH RD | 38 |
| SUMMERWOOD LN | 38 |
| WINDWARD | 38 |
| LEXINGTON FARM DR | 36 |
| RUCKER RD | 36 |
| MID BROADWELL RD | 32 |
| GEORGIA HIGHWAY 400 | 30 |
| LAKE UNION HILL WAY | 30 |
| KIMBALL BRIDGE RD | 28 |
| Other | 1,256 |
2002 - 2018 National Fire Incident Reporting System (NFIRS) incidents
- Incident types reported to NFIRS in Alpharetta, GA
- 19,22547.1%Rescue & EMS
- 7,32117.9%Good Intent Call
- 4,64111.4%Service Call
- 4,34010.6%False Alarm
- 2,7566.7%Fire
- 2,3935.9%Hazardous Condition
- 970.2%Special Incident
- 460.1%Severe Weather
- Fire incident types reported to NFIRS in Alpharetta, GA
- 1,10540.1%Outside Fires
- 1,06738.7%Structure Fires
- 49818.1%Mobile Property/Vehicle Fires
- 863.1%Other
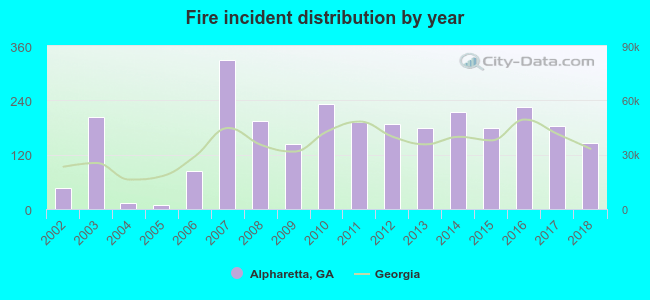 Based on the data from the years 2002 - 2018 the average number of fire incidents per year is 162. The highest number of reported fire incidents - 328 took place in 2007, and the least - 9 in 2005. The data has an increasing trend.
The average number of yearly fire incidents per 10k residents in Alpharetta, GA compared to nearest cities:
(Note: Based on data for the last 3 years, including only cities with population 5,000 and above)
| Alpharetta: | 29.3 |
| Roswell: | 18.7 |
| Johns Creek: | 8.3 |
| Milton: | 24.2 |
| Duluth: | 65.1 |
| Dunwoody: | 5.3 |
| Norcross: | 137.6 |
| Sandy Springs: | 20.1 |
| Doraville: | 21.8 |
 The median response time based on all reported fire incidents is 5 minutes. This is lower than the state median value.
The median response time in Alpharetta, GA compared to nearest cities:
(Note: Based on data for all years, including only cities with at least 500 fire incidents)
| Alpharetta: | 5 minutes |
| Roswell: | 6 minutes |
| Johns Creek: | 6 minutes |
| Milton: | 6 minutes |
| Duluth: | 7 minutes |
| Norcross: | 7 minutes |
| Sandy Springs: | 6 minutes |
| Suwanee: | 8 minutes |
| Cumming: | 7 minutes |
 Based on the reports from the years 2002 - 2018 the average number of fire-related casualties per year is 2. The highest number of reported casualties - 6 took place in 2008, and the lowest - 0 in 2002. The data has a rising trend.
The average number of injuries per 1,000 fire incidents is 13. This indicator was the highest - 71 in 2004, and the lowest 0 in 2002. The trend for casualties per 1,000 fire incidents is rising. Compared to the Georgia value the number of injuries per 1,000 fire incidents is similar.
Based on the reports from the years 2002 - 2018 the average number of fire-related casualties per year is 2. The highest number of reported casualties - 6 took place in 2008, and the lowest - 0 in 2002. The data has a rising trend.
The average number of injuries per 1,000 fire incidents is 13. This indicator was the highest - 71 in 2004, and the lowest 0 in 2002. The trend for casualties per 1,000 fire incidents is rising. Compared to the Georgia value the number of injuries per 1,000 fire incidents is similar.Casualties per 1,000 incidents in Alpharetta, GA compared to nearest cities:
(Note: Based on data for all years, including only cities with at least 500 fire incidents)
| Alpharetta: | 10.5 |
| Roswell: | 19.4 |
| Johns Creek: | 16.1 |
| Milton: | 11.8 |
| Duluth: | 15.3 |
| Norcross: | 19.0 |
| Sandy Springs: | 7.1 |
| Suwanee: | 10.3 |
| Cumming: | 7.6 |
 26.5% incidents where reported in the morning and 73.5% in the evening. The most fires (15.9%) took place on Sunday, and the least (12.7%) on Wednesday.
 Based on the 2,756 fires from years 2002 - 2018 most fires (9.5%) took place during April, and the least (6.4%) in December.
 Out of all 40,859 cases reported during the years 2002 - 2018, the most belonged to the categories: Rescue & EMS (47.1%), Good Intent Call (17.9%), and Service Call (11.4%).
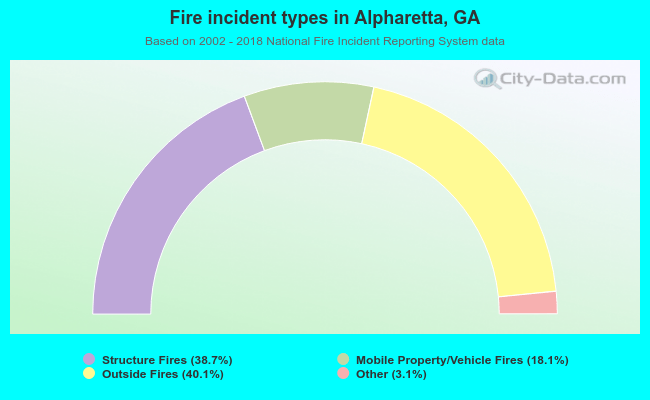 When looking into fire subcategories, the most reports belonged to: Outside Fires (40.1%), and Structure Fires (38.7%).