Hanover: Fire Incidents, Massachusetts (MA)
Where are fire incidents reported in Hanover, MA
Something went wrong! Please refresh the page.
| Fire incidents reported | |
|---|---|
| Sreet name | Count |
| WASHINGTON ST | 398 |
| WASHINGTON ST | 108 |
| COLUMBIA RD | 72 |
| BROADWAY | 68 |
| HANOVER ST | 62 |
| MAIN ST | 52 |
| CIRCUIT ST | 48 |
| ELMWOOD FARM DR | 38 |
| KING ST | 34 |
| FRANKS LN | 28 |
| HANOVER ST | 28 |
| WEBSTER ST | 28 |
| COLUMBIA RD | 26 |
| ROCKLAND ST | 22 |
| WINTER ST | 22 |
| CEDAR ST | 20 |
| BROADWAY ST | 18 |
| WHITING ST | 18 |
| ELMWOOD FARM DR | 16 |
| WHITING ST | 16 |
| WINTER ST | 16 |
| CIRCUIT ST | 14 |
| LEGION DR | 14 |
| MAIN ST | 14 |
| OLD WASHINGTON ST | 14 |
| KING ST | 12 |
| MAYFLOWER CR | 12 |
| MILL ST | 12 |
| PLEASANT ST | 12 |
| SILVER ST | 12 |
2002 - 2018 National Fire Incident Reporting System (NFIRS) incidents
- Incident types reported to NFIRS in Hanover, MA
- 8,37047.8%Rescue & EMS
- 3,79021.7%Hazardous Condition
- 2,05611.7%Service Call
- 1,3287.6%False Alarm
- 9965.7%Fire
- 8524.9%Good Intent Call
- 490.3%Severe Weather
- 320.2%Special Incident
- 270.2%Overpressure Rupture
- Fire incident types reported to NFIRS in Hanover, MA
- 48048.2%Outside Fires
- 37337.4%Structure Fires
- 13113.2%Mobile Property/Vehicle Fires
- 121.2%Other
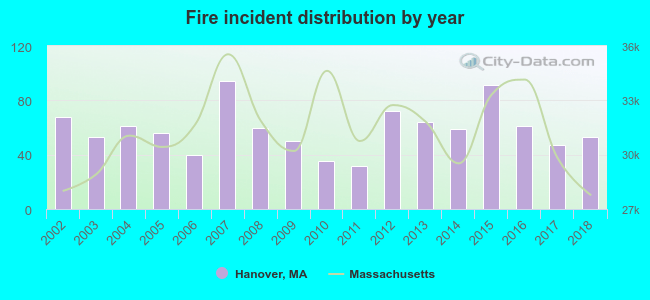 Based on the data from the years 2002 - 2018 the average number of fire incidents per year is 59. The highest number of reported fires - 94 took place in 2007, and the least - 32 in 2011. The data has a dropping trend.
The average number of yearly fire incidents per 10k residents in Hanover, MA compared to nearest cities:
(Note: Based on data for the last 3 years, including only cities with population 5,000 and above)
| Hanover: | 38.7 |
| Norwell: | 40.0 |
| Rockland: | 46.9 |
| Abington: | 34.0 |
| Whitman: | 19.8 |
| Pembroke: | 3.6 |
| Weymouth: | 50.1 |
| Hingham: | 140.4 |
| Scituate: | 125.2 |
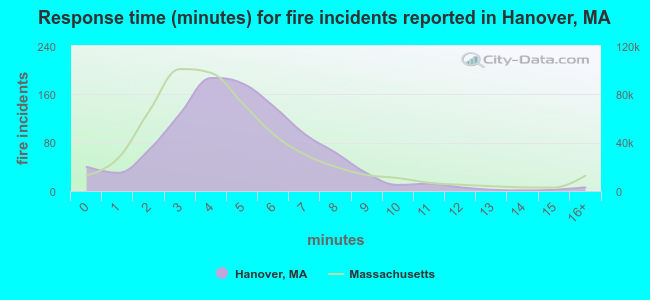 The median response time based on all reported fire incidents is 5 minutes. This is higher compared to the state median value.
The median response time in Hanover, MA compared to nearest cities:
(Note: Based on data for all years, including only cities with at least 500 fire incidents)
| Hanover: | 5 minutes |
| Norwell: | 5 minutes |
| Rockland: | 3 minutes |
| Hanson: | 5 minutes |
| Abington: | 4 minutes |
| Whitman: | 2 minutes |
| Weymouth: | 4 minutes |
| Hingham: | 5 minutes |
| Scituate: | 4 minutes |
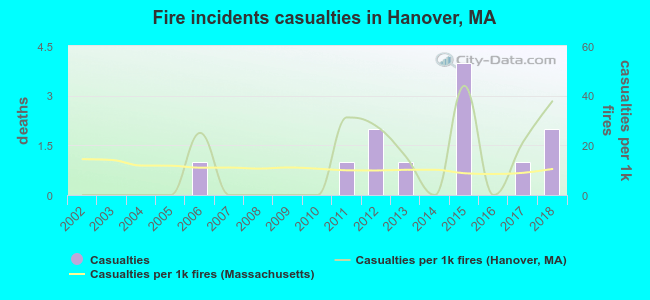 According to the data from the years 2002 - 2018 the average number of fire-related casualties per year is 1. The highest number of casualties - 4 took place in 2015, and the lowest - 0 in 2002. The data has a growing trend.
The average number of casualties per 1,000 fires is 12. This indicator was the highest - 44 in 2015, and the lowest 0 in 2002. The trend for injuries per 1,000 fires is increasing. Compared to the state value the number of injuries per 1,000 incidents is about the same.
According to the data from the years 2002 - 2018 the average number of fire-related casualties per year is 1. The highest number of casualties - 4 took place in 2015, and the lowest - 0 in 2002. The data has a growing trend.
The average number of casualties per 1,000 fires is 12. This indicator was the highest - 44 in 2015, and the lowest 0 in 2002. The trend for injuries per 1,000 fires is increasing. Compared to the state value the number of injuries per 1,000 incidents is about the same.
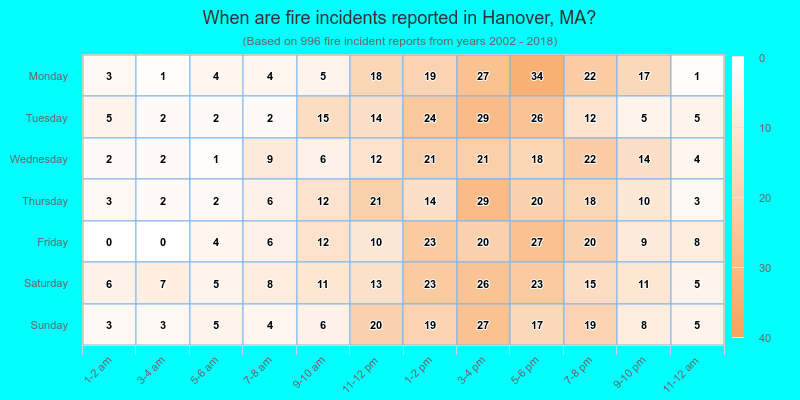
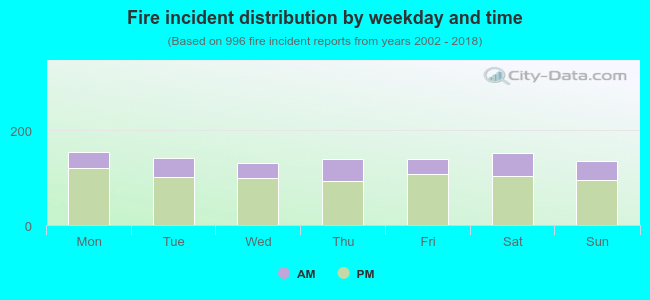 27.7% incidents where reported in the morning and 72.3% in the evening. The most fires (15.6%) took place on Monday, and the least (13.3%) on Wednesday.
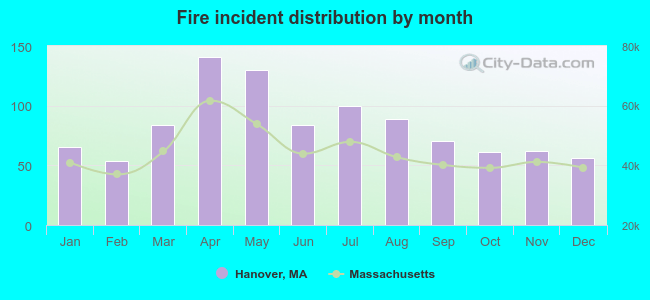 Based on the 996 incident reports from years 2002 - 2018 most fires (14.2%) took place during April, and the least (5.4%) in February.
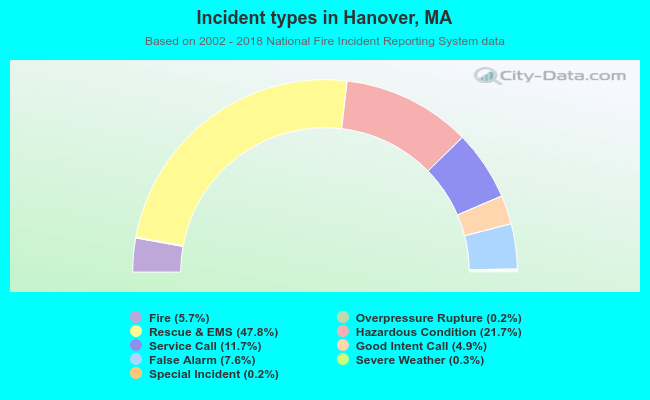 Out of all 17,500 cases reported during the years 2002 - 2018, the most belonged to the categories: Rescue & EMS (47.8%), Hazardous Condition (21.7%), and Service Call (11.7%).
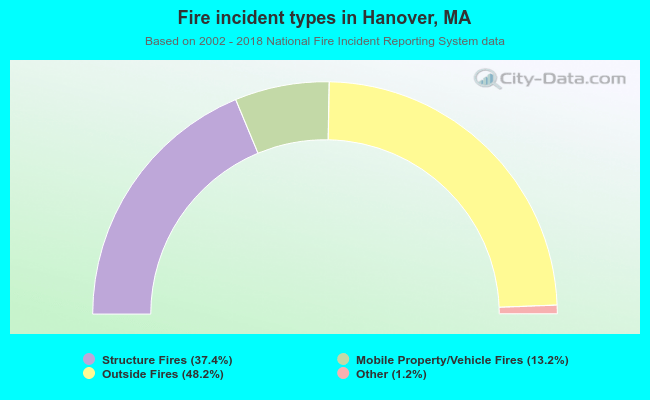 When looking into fire subcategories, the most reports belonged to: Outside Fires (48.2%), and Structure Fires (37.4%).