Abington: Fire Incidents, Massachusetts (MA)
Where are fire incidents reported in Abington, MA
Something went wrong! Please refresh the page.
| Fire incidents reported | |
|---|---|
| Sreet name | Count |
| BEDFORD ST | 222 |
| BROCKTON AVE | 188 |
| CENTRE AVE | 172 |
| CHESTNUT ST | 120 |
| PLYMOUTH ST | 108 |
| WASHINGTON ST | 108 |
| ADAMS ST | 82 |
| CENTRAL ST | 74 |
| NORTH AVE | 72 |
| NORTH QUINCY ST | 68 |
| HANCOCK ST | 62 |
| RANDOLPH ST | 56 |
| GROVELAND ST | 52 |
| ROCKLAND ST | 52 |
| LINCOLN ST | 44 |
| LINWOOD ST | 38 |
| WALNUT ST | 38 |
| SUMMER ST | 30 |
| WOODLANDS WAY | 30 |
| ASHLAND ST | 24 |
| FORSYTH DR | 22 |
| HAMPTON WAY | 22 |
| HIGH ST | 22 |
| RAILROAD ST | 22 |
| TOWNSEND ST | 22 |
| THAYER ST | 20 |
| WALES ST | 20 |
| GREEN ST | 18 |
| SHAW AVE | 18 |
| DUNBAR ST | 16 |
2002 - 2018 National Fire Incident Reporting System (NFIRS) incidents
- Incident types reported to NFIRS in Abington, MA
- 11,68652.2%Rescue & EMS
- 4,13918.5%Hazardous Condition
- 2,1299.5%False Alarm
- 1,9658.8%Service Call
- 1,3586.1%Fire
- 9944.4%Good Intent Call
- 820.4%Special Incident
- 270.1%Overpressure Rupture
- Fire incident types reported to NFIRS in Abington, MA
- 64447.4%Structure Fires
- 51838.1%Outside Fires
- 14510.7%Mobile Property/Vehicle Fires
- 513.8%Other
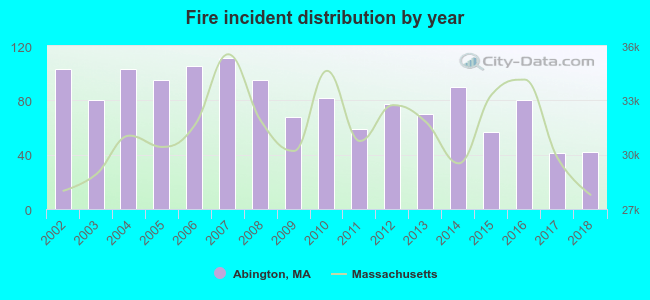 According to the data from the years 2002 - 2018 the average number of fires per year is 80. The highest number of reported fires - 111 took place in 2007, and the least - 41 in 2017. The data has a decreasing trend.
The average number of yearly fire incidents per 10k residents in Abington, MA compared to nearest cities:
(Note: Based on data for the last 3 years, including only cities with population 5,000 and above)
| Abington: | 34.0 |
| Rockland: | 46.9 |
| Whitman: | 19.8 |
| Holbrook: | 47.3 |
| Brockton: | 60.2 |
| Hanover: | 38.7 |
| Weymouth: | 50.1 |
| East Bridgewater: | 25.9 |
| Randolph: | 60.2 |
 The median response time based on all reported fire incidents is 4 minutes. This is about the same as the Massachusetts median value.
The median response time in Abington, MA compared to nearest cities:
(Note: Based on data for all years, including only cities with at least 500 fire incidents)
| Abington: | 4 minutes |
| Rockland: | 3 minutes |
| Whitman: | 2 minutes |
| Holbrook: | 3 minutes |
| Brockton: | 4 minutes |
| Hanover: | 5 minutes |
| Avon: | 4 minutes |
| Weymouth: | 4 minutes |
| Hanson: | 5 minutes |
 According to the reports from the years 2002 - 2018 the average number of fire-related casualties per year is 1. The highest number of injuries - 12 took place in 2009, and the lowest - 0 in 2002. The data has a constant trend.
The average number of casualties per 1,000 fire incidents is 17. This indicator was the highest - 176 in 2009, and the lowest 0 in 2002. The trend for casualties per 1,000 fires is constant. Compared to the state value the number of injuries per 1,000 fire incidents is higher.
According to the reports from the years 2002 - 2018 the average number of fire-related casualties per year is 1. The highest number of injuries - 12 took place in 2009, and the lowest - 0 in 2002. The data has a constant trend.
The average number of casualties per 1,000 fire incidents is 17. This indicator was the highest - 176 in 2009, and the lowest 0 in 2002. The trend for casualties per 1,000 fires is constant. Compared to the state value the number of injuries per 1,000 fire incidents is higher.
 28.4% incidents where reported in the morning and 71.6% in the evening. The most fires (16.1%) took place on Saturday, and the least (13.0%) on Friday.
 Based on the 1,358 fire incidents from years 2002 - 2018 most fires (14.4%) took place during April, and the least (4.6%) in February.
 Out of all 22,385 cases reported during the years 2002 - 2018, the most belonged to the categories: Rescue & EMS (52.2%), Hazardous Condition (18.5%), and False Alarm (9.5%).
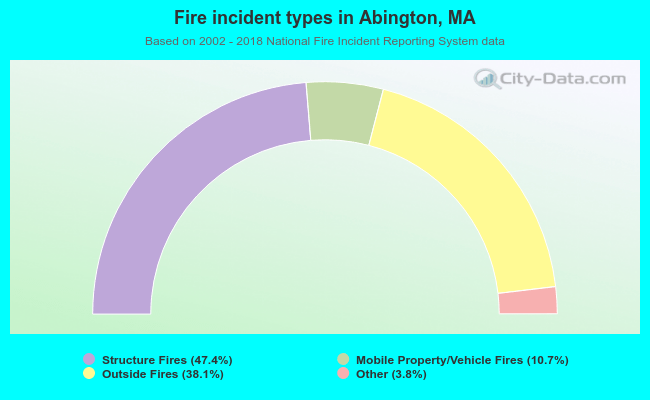 When looking into fire subcategories, the most incidents belonged to: Structure Fires (47.4%), and Outside Fires (38.1%).