Grandview: Fire Incidents, Missouri (MO)
Where are fire incidents reported in Grandview, MO
Something went wrong! Please refresh the page.
| Fire incidents reported | |
|---|---|
| Sreet name | Count |
| 126TH ST | 80 |
| US 71 HWY | 68 |
| MAIN ST | 62 |
| 129TH ST | 52 |
| 71 HWY | 46 |
| 127TH ST | 42 |
| 125TH ST | 38 |
| BLUE RIDGE BLVD | 38 |
| DUCK RD | 38 |
| GRANDVIEW RD | 36 |
| 135TH ST | 32 |
| HARRY TRUMAN DR | 30 |
| BLUE RIDGE EXT | 28 |
| WHITE AVE | 26 |
| HOLIDAY DR | 24 |
| 138TH ST | 22 |
| 139TH ST | 22 |
| BLUE RIDGE EXT | 22 |
| BOTTS RD | 22 |
| 128TH ST | 20 |
| 133RD ST | 20 |
| 136TH ST | 20 |
| HIGH GROVE RD | 20 |
| 147TH ST | 18 |
| 150 HWY | 18 |
| 155TH ST | 18 |
| MARTHA TRUMAN RD | 18 |
| THOMAS AVE | 18 |
| 123RD TER | 16 |
| 13TH ST | 16 |
| Other | 390 |
2002 - 2018 National Fire Incident Reporting System (NFIRS) incidents
- Incident types reported to NFIRS in Grandview, MO
- 14,84367.2%Rescue & EMS
- 2,30310.4%Good Intent Call
- 1,4466.5%Service Call
- 1,3206.0%Fire
- 1,2475.6%Hazardous Condition
- 8824.0%False Alarm
- 290.1%Severe Weather
- Fire incident types reported to NFIRS in Grandview, MO
- 61046.2%Structure Fires
- 43432.9%Outside Fires
- 24618.6%Mobile Property/Vehicle Fires
- 302.3%Other
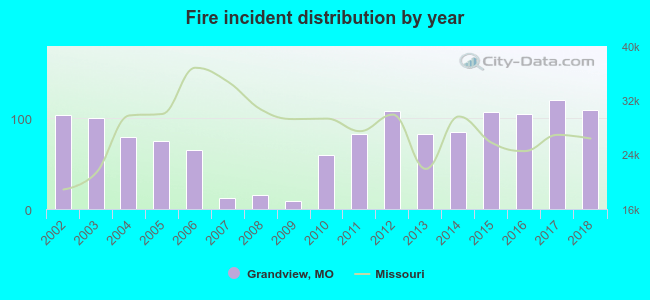 Based on the data from the years 2002 - 2018 the average number of fires per year is 78. The highest number of reported fires - 120 took place in 2017, and the least - 9 in 2009. The data has a rising trend.
The average number of yearly fire incidents per 10k residents in Grandview, MO compared to nearest cities:
(Note: Based on data for the last 3 years, including only cities with population 5,000 and above)
| Grandview: | 44.0 |
| Belton: | 34.0 |
| Raymore: | 10.5 |
| Raytown: | 6.4 |
| Greenwood: | 23.1 |
| Kansas City: | 38.0 |
| Independence: | 40.0 |
| Pleasant Hill: | 32.7 |
| Blue Springs: | 19.5 |
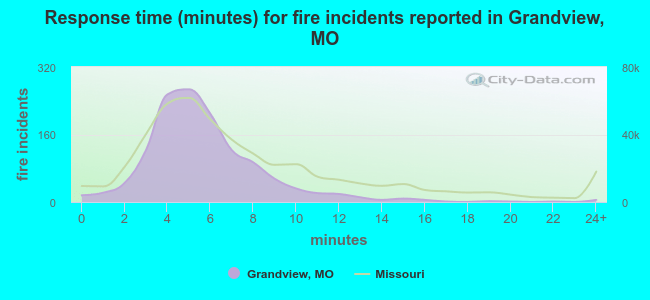 The median response time based on all reported fire incidents is 5 minutes. This is lower compared to the state median value.
The median response time in Grandview, MO compared to nearest cities:
(Note: Based on data for all years, including only cities with at least 500 fire incidents)
| Grandview: | 5 minutes |
| Belton: | 6 minutes |
| Leawood: | 5 minutes |
| Raymore: | 6 minutes |
| Raytown: | 5 minutes |
| Lee's Summit: | 6 minutes |
| Overland Park: | 6 minutes |
| Peculiar: | 8 minutes |
| Merriam: | 5 minutes |
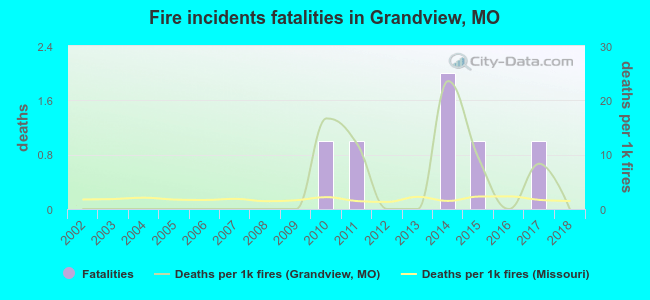 Based on the data from the years 2002 - 2018 the average number of fire-related fatalities per year is 0. The highest number of deaths - 2 took place in 2014, and the lowest - 0 in 2002. The data has a constant trend.
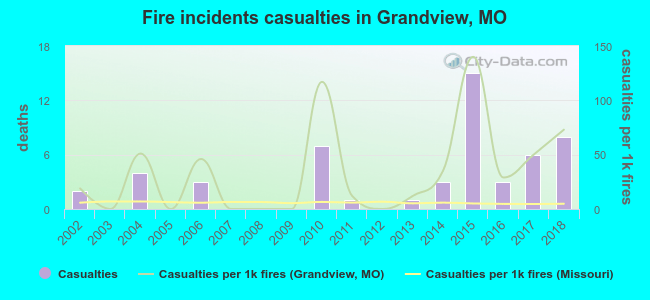 Based on the data from the years 2002 - 2018 the average number of fire-related casualties per year is 3. The highest number of casualties - 15 took place in 2015, and the lowest - 0 in 2003. The data has an increasing trend.
The average number of casualties per 1,000 fires is 34. This indicator was the highest - 140 in 2015, and the lowest 0 in 2003. The trend for injuries per 1,000 incidents is increasing. Compared to the state value the number of casualties per 1,000 incidents is much higher.
Based on the data from the years 2002 - 2018 the average number of fire-related casualties per year is 3. The highest number of casualties - 15 took place in 2015, and the lowest - 0 in 2003. The data has an increasing trend.
The average number of casualties per 1,000 fires is 34. This indicator was the highest - 140 in 2015, and the lowest 0 in 2003. The trend for injuries per 1,000 incidents is increasing. Compared to the state value the number of casualties per 1,000 incidents is much higher.Casualties per 1,000 incidents in Grandview, MO compared to nearest cities:
(Note: Based on data for all years, including only cities with at least 500 fire incidents)
| Grandview: | 40.2 |
| Belton: | 14.5 |
| Leawood: | 8.3 |
| Raymore: | 6.8 |
| Raytown: | 1.5 |
| Lee's Summit: | 1.6 |
| Overland Park: | 25.7 |
| Peculiar: | 8.4 |
| Merriam: | 9.6 |
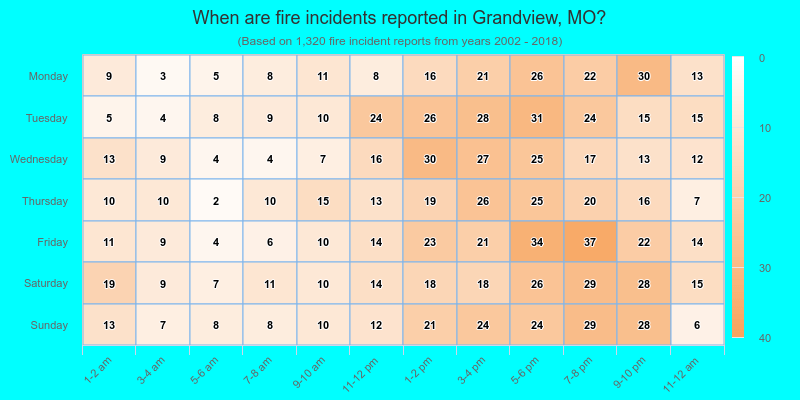
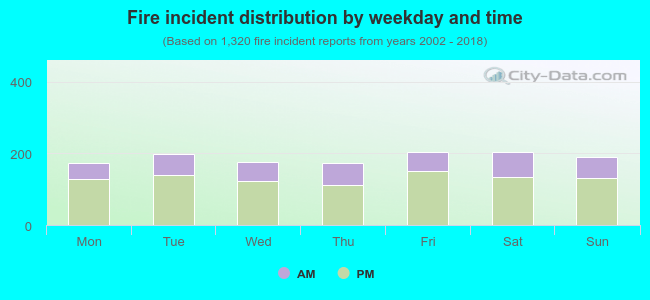 30.2% incidents where reported in the morning and 69.8% in the evening. The most fires (15.5%) took place on Friday, and the least (13.0%) on Monday.
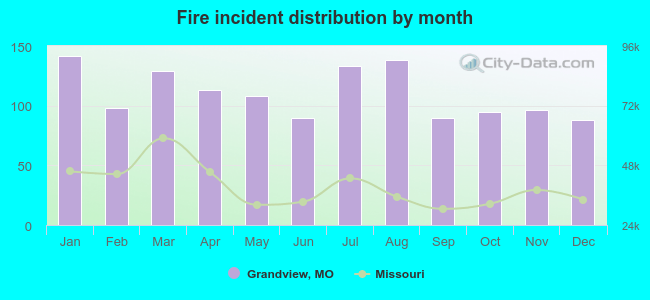 According to the 1,320 fire incidents from years 2002 - 2018 most fires (10.8%) took place during January, and the least (6.7%) in December.
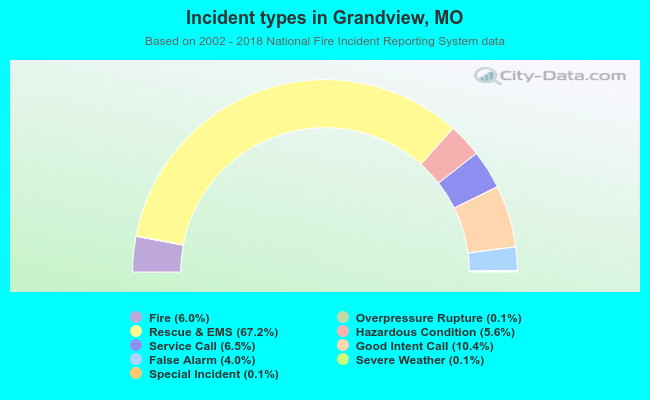 Out of all 22,100 cases reported during the years 2002 - 2018, the most belonged to the categories: Rescue & EMS (67.2%), Good Intent Call (10.4%), and Service Call (6.5%).
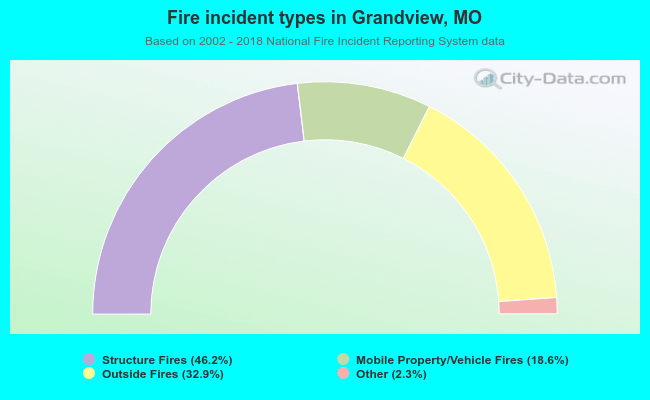 When looking into fire subcategories, the most reports belonged to: Structure Fires (46.2%), and Outside Fires (32.9%).