Blue Springs: Fire Incidents, Missouri (MO)
Where are fire incidents reported in Blue Springs, MO
Something went wrong! Please refresh the page.
| Fire incidents reported | |
|---|---|
| Sreet name | Count |
| 7 HWY | 208 |
| 40 HWY | 142 |
| WOODS CHAPEL RD | 98 |
| 7 HWY | 90 |
| CORONADO DR | 72 |
| CANDLETREE DR | 66 |
| M 7 HWY | 60 |
| 6TH ST | 52 |
| ADAMS DAIRY PKY | 52 |
| JEFFERSON ST | 46 |
| SUNNYSIDE SCHOOL RD | 46 |
| 10TH ST | 44 |
| 40 HWY | 42 |
| 15TH ST | 40 |
| DUNCAN RD | 38 |
| US 40 HWY | 38 |
| I 70 HWY | 34 |
| 2ND ST | 32 |
| VESPER ST | 32 |
| 13TH ST | 30 |
| 19TH ST | 28 |
| 22ND ST | 28 |
| 9TH ST | 28 |
| CANDLETREE DR | 28 |
| CORONADO DR | 28 |
| SOUTH OUTER RD | 28 |
| MORELAND SCHOOL RD | 26 |
| 1ST ST | 24 |
| 3RD ST | 24 |
| PARK RD | 24 |
| Other | 1,003 |
2002 - 2018 National Fire Incident Reporting System (NFIRS) incidents
- Incident types reported to NFIRS in Blue Springs, MO
- 24,93168.5%Rescue & EMS
- 2,5317.0%Fire
- 2,5036.9%Service Call
- 2,4916.8%Hazardous Condition
- 2,1946.0%Good Intent Call
- 1,6954.7%False Alarm
- Fire incident types reported to NFIRS in Blue Springs, MO
- 1,03140.7%Outside Fires
- 99339.2%Structure Fires
- 43017.0%Mobile Property/Vehicle Fires
- 773.0%Other
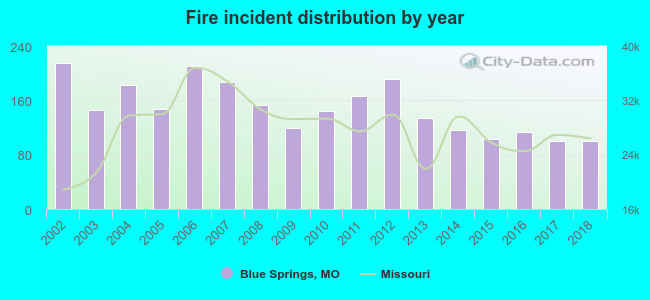 Based on the data from the years 2002 - 2018 the average number of fire incidents per year is 149. The highest number of fire incidents - 215 took place in 2002, and the least - 100 in 2017. The data has a declining trend.
The average number of yearly fire incidents per 10k residents in Blue Springs, MO compared to nearest cities:
(Note: Based on data for the last 3 years, including only cities with population 5,000 and above)
| Blue Springs: | 19.5 |
| Grain Valley: | 22.4 |
| Oak Grove: | 48.7 |
| Independence: | 40.0 |
| Raytown: | 6.4 |
| Greenwood: | 23.1 |
| Kansas City: | 38.0 |
| Pleasant Hill: | 32.7 |
| Grandview: | 44.0 |
 The median response time based on all reported fire incidents is 5 minutes. This is lower compared to the Missouri median value.
The median response time in Blue Springs, MO compared to nearest cities:
(Note: Based on data for all years, including only cities with at least 500 fire incidents)
| Blue Springs: | 5 minutes |
| Grain Valley: | 6 minutes |
| Oak Grove: | 8 minutes |
| Independence: | 5 minutes |
| Lee's Summit: | 6 minutes |
| Raytown: | 5 minutes |
| Kansas City: | 5 minutes |
| Pleasant Hill: | 8 minutes |
| Grandview: | 5 minutes |
 Based on the data from the years 2002 - 2018 the average number of fire-related casualties per year is 2. The highest number of injuries - 6 took place in 2010, and the lowest - 0 in 2003. The data has a decreasing trend.
The average number of injuries per 1,000 fires is 13. This indicator was the highest - 41 in 2010, and the lowest 0 in 2003. The trend for injuries per 1,000 fires is declining. Compared to the Missouri value the number of casualties per 1,000 fires is much higher.
Based on the data from the years 2002 - 2018 the average number of fire-related casualties per year is 2. The highest number of injuries - 6 took place in 2010, and the lowest - 0 in 2003. The data has a decreasing trend.
The average number of injuries per 1,000 fires is 13. This indicator was the highest - 41 in 2010, and the lowest 0 in 2003. The trend for injuries per 1,000 fires is declining. Compared to the Missouri value the number of casualties per 1,000 fires is much higher.Casualties per 1,000 incidents in Blue Springs, MO compared to nearest cities:
(Note: Based on data for all years, including only cities with at least 500 fire incidents)
| Blue Springs: | 13.8 |
| Grain Valley: | 4.9 |
| Oak Grove: | 12.4 |
| Independence: | 16.0 |
| Lee's Summit: | 1.6 |
| Raytown: | 1.5 |
| Kansas City: | 9.7 |
| Pleasant Hill: | 13.8 |
| Grandview: | 40.2 |
 28.7% incidents where reported in the morning and 71.3% in the evening. The most fires (16.2%) took place on Saturday, and the least (13.3%) on Wednesday.
 According to the 2,531 fires from years 2002 - 2018 most fires (11.9%) took place during July, and the least (6.7%) in October.
 Out of all 36,416 cases reported during the years 2002 - 2018, the most belonged to the categories: Rescue & EMS (68.5%), Fire (7.0%), and Service Call (6.9%).
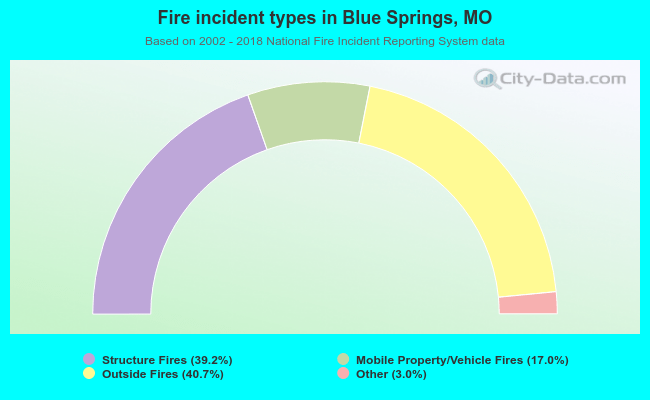 When looking into fire subcategories, the most reports belonged to: Outside Fires (40.7%), and Structure Fires (39.2%).