Gorham: Fire Incidents, Maine (ME)
Where are fire incidents reported in Gorham, ME
Something went wrong! Please refresh the page.
| Fire incidents reported | |
|---|---|
| Sreet name | Count |
| MAIN ST | 88 |
| COUNTY RD | 72 |
| FORT HILL RD | 62 |
| NEW PORTLAND RD | 60 |
| COLLEGE AVE | 56 |
| BURNHAM RD | 50 |
| OSSIPEE TRL | 48 |
| SEBAGO LAKE RD | 46 |
| SOUTH ST | 44 |
| GRAY RD | 40 |
| NARRAGANSETT ST | 30 |
| DOW RD | 26 |
| MOSHER RD | 26 |
| FLAGGY MEADOW RD | 24 |
| HUSTON RD | 24 |
| NORTH GORHAM RD | 24 |
| SCHOOL ST | 24 |
| STATE ST | 24 |
| BRACKETT RD | 22 |
| CAMPUS AVE | 22 |
| SPILLER RD | 20 |
| UNIVERSITY WAY | 20 |
| BARTLETT RD | 18 |
| HUSKY DR | 18 |
| LIBBY AVE | 18 |
| MCLELLAN RD | 18 |
| MIGHTY ST | 18 |
| PLUMMER RD | 16 |
| WOOD RD | 16 |
| GORHAM RD | 14 |
2002 - 2018 National Fire Incident Reporting System (NFIRS) incidents
- Incident types reported to NFIRS in Gorham, ME
- 7,28655.5%Rescue & EMS
- 1,83814.0%Hazardous Condition
- 1,0417.9%Service Call
- 1,0197.8%False Alarm
- 9287.1%Fire
- 9247.0%Good Intent Call
- 630.5%Special Incident
- 240.2%Overpressure Rupture
- 140.1%Severe Weather
- Fire incident types reported to NFIRS in Gorham, ME
- 50854.7%Structure Fires
- 20722.3%Outside Fires
- 12713.7%Mobile Property/Vehicle Fires
- 869.3%Other
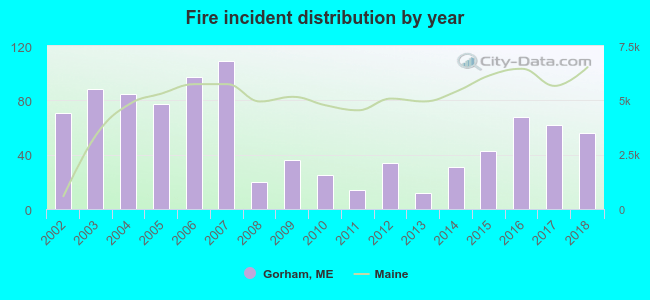 According to the data from the years 2002 - 2018 the average number of fires per year is 55. The highest number of fire incidents - 109 took place in 2007, and the least - 12 in 2013. The data has a declining trend.
The average number of yearly fire incidents per 10k residents in Gorham, ME compared to nearest cities:
(Note: Based on data for the last 3 years, including only cities with population 5,000 and above)
| Gorham: | 90.1 |
| Westbrook: | 33.0 |
| Buxton: | 31.5 |
| Standish: | 22.3 |
| Portland: | 31.0 |
| Windham: | 44.1 |
| South Portland: | 37.0 |
| Falmouth: | 24.7 |
| Saco: | 41.2 |
 The median response time based on all reported fire incidents is 7 minutes. This is comparable to the state median value.
The median response time in Gorham, ME compared to nearest cities:
(Note: Based on data for all years, including only cities with at least 500 fire incidents)
| Gorham: | 7 minutes |
| Westbrook: | 5 minutes |
| Scarborough: | 7 minutes |
| Portland: | 4 minutes |
| Windham: | 6 minutes |
| South Portland: | 6 minutes |
| Saco: | 7 minutes |
| Biddeford: | 7 minutes |
| Freeport: | 8 minutes |
 Based on the reports from the years 2002 - 2018 the average number of fire-related casualties per year is 1. The highest number of casualties - 3 took place in 2003, and the lowest - 0 in 2002. The data has a constant trend.
The average number of injuries per 1,000 fire incidents is 7. This indicator was the highest - 34 in 2003, and the lowest 0 in 2002. The trend for injuries per 1,000 fires is growing. Compared to the state value the number of casualties per 1,000 fires is higher.
Based on the reports from the years 2002 - 2018 the average number of fire-related casualties per year is 1. The highest number of casualties - 3 took place in 2003, and the lowest - 0 in 2002. The data has a constant trend.
The average number of injuries per 1,000 fire incidents is 7. This indicator was the highest - 34 in 2003, and the lowest 0 in 2002. The trend for injuries per 1,000 fires is growing. Compared to the state value the number of casualties per 1,000 fires is higher.Casualties per 1,000 incidents in Gorham, ME compared to nearest cities:
(Note: Based on data for all years, including only cities with at least 500 fire incidents)
| Gorham: | 10.8 |
| Westbrook: | 35.2 |
| Scarborough: | 6.5 |
| Portland: | 5.2 |
| Windham: | 21.2 |
| South Portland: | 2.3 |
| Saco: | 17.0 |
| Biddeford: | 23.1 |
| Freeport: | 4.7 |
 31.6% incidents where reported in the morning and 68.4% in the evening. The most fires (17.8%) took place on Monday, and the least (11.2%) on Sunday.
 According to the 928 fire incident reports from years 2002 - 2018 most fires (13.3%) took place during April, and the least (6.0%) in September.
 Out of all 13,137 cases reported during the years 2002 - 2018, the most belonged to the categories: Rescue & EMS (55.5%), Hazardous Condition (14.0%), and Service Call (7.9%).
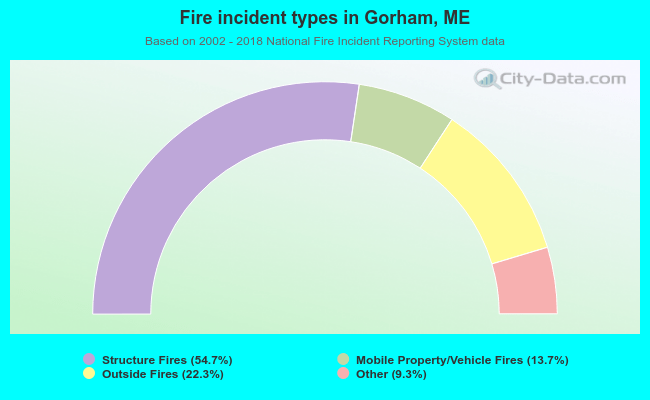 When looking into fire subcategories, the most incidents belonged to: Structure Fires (54.7%), and Outside Fires (22.3%).