Falmouth: Fire Incidents, Maine (ME)
Where are fire incidents reported in Falmouth, ME
Something went wrong! Please refresh the page.
|
| |||||||||||||||||||||||||||||||||||||||||||||||||||||||||||||||||||||||||||||||||||||||||||||||||||||||||||||
2003 - 2018 National Fire Incident Reporting System (NFIRS) incidents
- Incident types reported to NFIRS in Falmouth, ME
- 3,77363.4%Rescue & EMS
- 5829.8%False Alarm
- 5339.0%Service Call
- 5048.5%Hazardous Condition
- 3906.6%Fire
- 1602.7%Good Intent Call
- 70.1%Severe Weather
- Fire incident types reported to NFIRS in Falmouth, ME
- 19750.5%Structure Fires
- 11930.5%Outside Fires
- 6717.2%Mobile Property/Vehicle Fires
- 71.8%Other
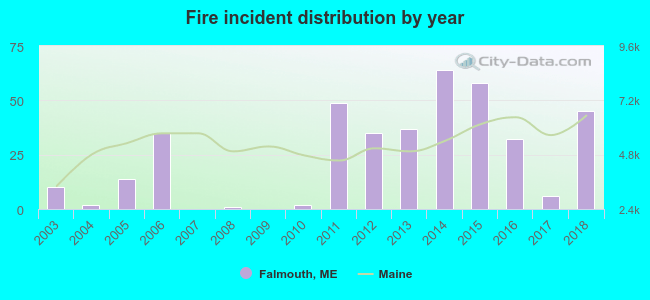 According to the data from the years 2003 - 2018 the average number of fire incidents per year is 24. The highest number of reported fire incidents - 64 took place in 2014, and the least - 0 in 2007. The data has a rising trend.
The average number of yearly fire incidents per 10k residents in Falmouth, ME compared to nearest cities:
(Note: Based on data for the last 3 years, including only cities with population 5,000 and above)
| Falmouth: | 24.7 |
| Cumberland: | 43.0 |
| Portland: | 31.0 |
| Yarmouth: | 36.3 |
| Westbrook: | 33.0 |
| South Portland: | 37.0 |
| Cape Elizabeth: | 25.5 |
| Windham: | 44.1 |
| Gorham: | 90.1 |

 29.2% incidents where reported in the morning and 70.8% in the evening. The most fires (19.5%) took place on Sunday, and the least (10.0%) on Tuesday.
 According to the 390 fires from years 2003 - 2018 most fires (12.8%) took place during May, and the least (4.1%) in October.
 Out of all 5,951 cases reported during the years 2003 - 2018, the most belonged to the categories: Rescue & EMS (63.4%), False Alarm (9.8%), and Service Call (9.0%).
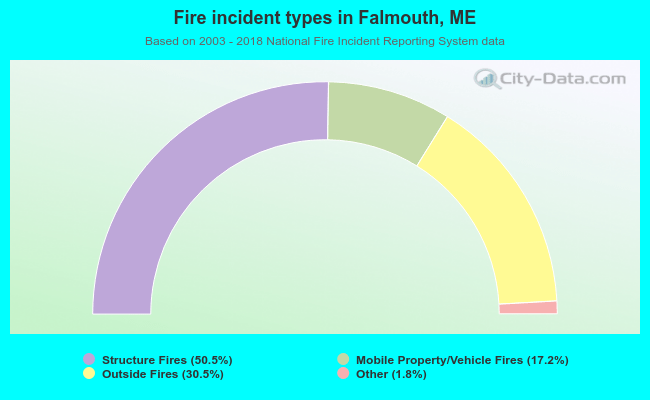 When looking into fire subcategories, the most incidents belonged to: Structure Fires (50.5%), and Outside Fires (30.5%).