Garden City: Fire Incidents, New York (NY)
Where are fire incidents reported in Garden City, NY
Something went wrong! Please refresh the page.
| Fire incidents reported | |
|---|---|
| Sreet name | Count |
| FRANKLIN AVE | 132 |
| STEWART AVE | 96 |
| SOUTH AVE | 56 |
| SEVENTH ST | 38 |
| ROCKAWAY AVE | 36 |
| CHERRY VALLEY AVE | 26 |
| STRATFORD AVE | 24 |
| CLINTON ROAD | 22 |
| NASSAU BLVD | 20 |
| PINE ST | 20 |
| GARDEN CITY PLZ | 18 |
| HILTON AVE | 18 |
| GARDEN CITY PLAZ | 16 |
| OLD COUNTRY RD | 16 |
| 7TH ST | 14 |
| MERILLON AVE | 14 |
| OXFORD BLVD | 14 |
| ROOSEVELT ST | 14 |
| CAMBRIDGE AVE | 12 |
| COMMERCIAL AVE | 12 |
| MEADOW ST | 12 |
| RAYMOND CT | 12 |
| STEWART | 12 |
| WYATT ROAD | 12 |
| 2ND ST | 10 |
| DARTMOUTH ST | 10 |
| EUSTON RD | 10 |
| LOCUST ST | 10 |
| OLD COUNTRY | 10 |
| PELL TER | 10 |
| Other | 67 |
2004 - 2018 National Fire Incident Reporting System (NFIRS) incidents
- Incident types reported to NFIRS in Garden City, NY
- 3,16139.4%Hazardous Condition
- 2,89836.1%False Alarm
- 7939.9%Fire
- 5196.5%Good Intent Call
- 3334.1%Service Call
- 2933.7%Rescue & EMS
- 150.2%Overpressure Rupture
- 100.1%Special Incident
- Fire incident types reported to NFIRS in Garden City, NY
- 35544.8%Structure Fires
- 28235.6%Outside Fires
- 8711.0%Mobile Property/Vehicle Fires
- 698.7%Other
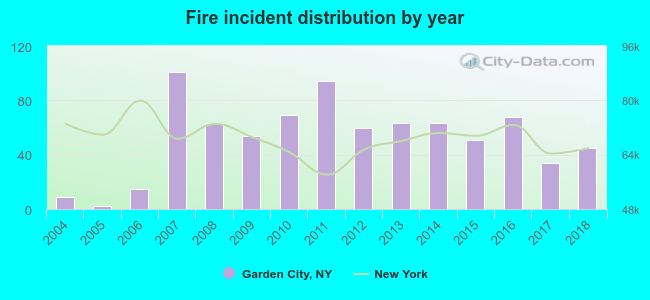 According to the data from the years 2004 - 2018 the average number of fires per year is 53. The highest number of reported fire incidents - 101 took place in 2007, and the least - 2 in 2005. The data has an increasing trend.
The average number of yearly fire incidents per 10k residents in Garden City, NY compared to nearest cities:
(Note: Based on data for the last 3 years, including only cities with population 5,000 and above)
| Garden City: | 21.7 |
| Garden City Park: | 7.3 |
| Mineola: | 15.4 |
| New Hyde Park: | 20.8 |
| West Hempstead: | 19.8 |
| Williston Park: | 14.1 |
| Franklin Square: | 5.1 |
| Hempstead: | 31.0 |
| North New Hyde Park: | 6.4 |
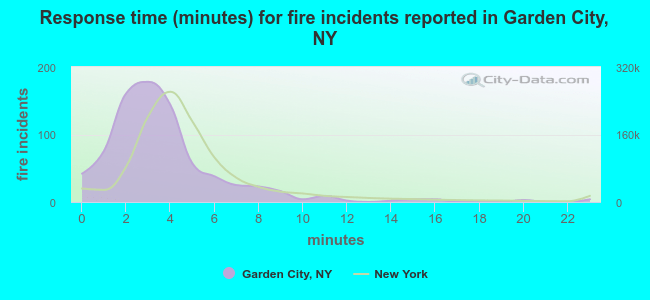 The median response time based on all reported fire incidents is 3 minutes. This is lower than the New York median value.
The median response time in Garden City, NY compared to nearest cities:
(Note: Based on data for all years, including only cities with at least 500 fire incidents)
| Garden City: | 3 minutes |
| New Hyde Park: | 4 minutes |
| West Hempstead: | 0 minutes |
| Franklin Square: | 4 minutes |
| Hempstead: | 3 minutes |
| Floral Park: | 2 minutes |
| Elmont: | 5 minutes |
| Baldwin: | 4 minutes |
| Lynbrook: | 3 minutes |
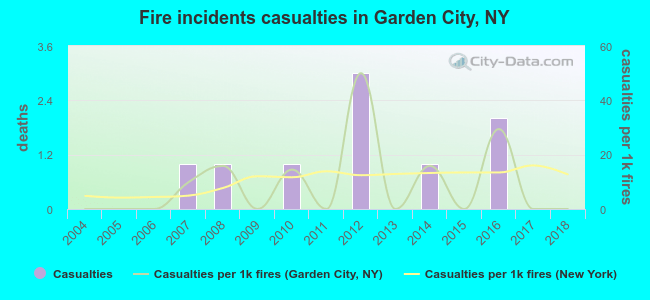 According to the reports from the years 2004 - 2018 the average number of fire-related casualties per year is 1. The highest number of reported casualties - 3 took place in 2012, and the lowest - 0 in 2004. The data has a constant trend.
The average number of injuries per 1,000 fires is 9. This indicator was the highest - 50 in 2012, and the lowest 0 in 2004. The trend for casualties per 1,000 incidents is constant. Compared to the New York value the number of casualties per 1,000 fires is about the same.
According to the reports from the years 2004 - 2018 the average number of fire-related casualties per year is 1. The highest number of reported casualties - 3 took place in 2012, and the lowest - 0 in 2004. The data has a constant trend.
The average number of injuries per 1,000 fires is 9. This indicator was the highest - 50 in 2012, and the lowest 0 in 2004. The trend for casualties per 1,000 incidents is constant. Compared to the New York value the number of casualties per 1,000 fires is about the same.Casualties per 1,000 incidents in Garden City, NY compared to nearest cities:
(Note: Based on data for all years, including only cities with at least 500 fire incidents)
| Garden City: | 11.3 |
| New Hyde Park: | 1.5 |
| West Hempstead: | 0.0 |
| Franklin Square: | 9.7 |
| Hempstead: | 21.2 |
| Floral Park: | 5.9 |
| Elmont: | 0.0 |
| Baldwin: | 1.2 |
| Lynbrook: | 43.6 |
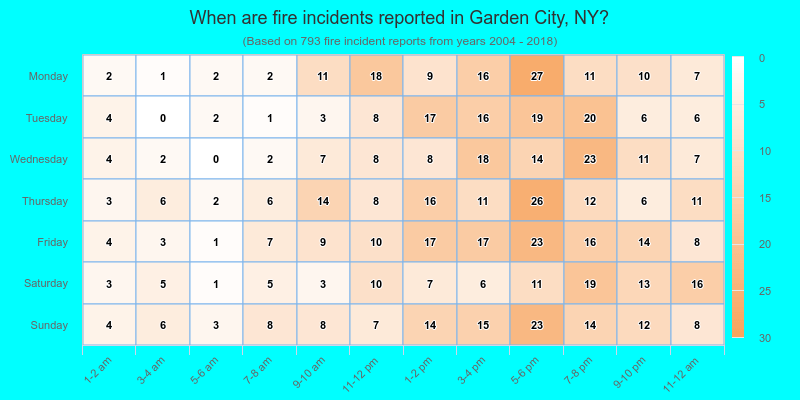
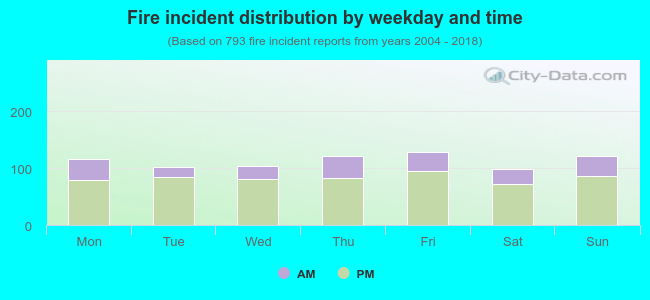 26.9% incidents where reported in the morning and 73.1% in the evening. The most fires (16.3%) took place on Friday, and the least (12.5%) on Saturday.
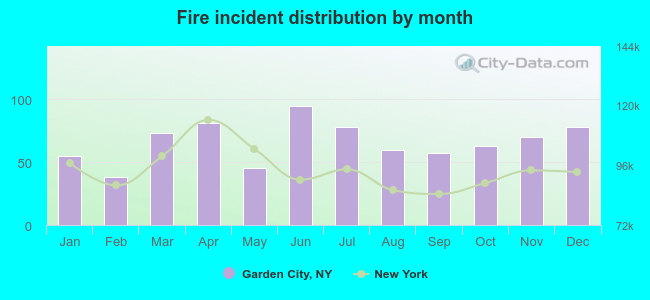 Based on the 793 fire incident reports from years 2004 - 2018 most fires (12.0%) took place during June, and the least (4.8%) in February.
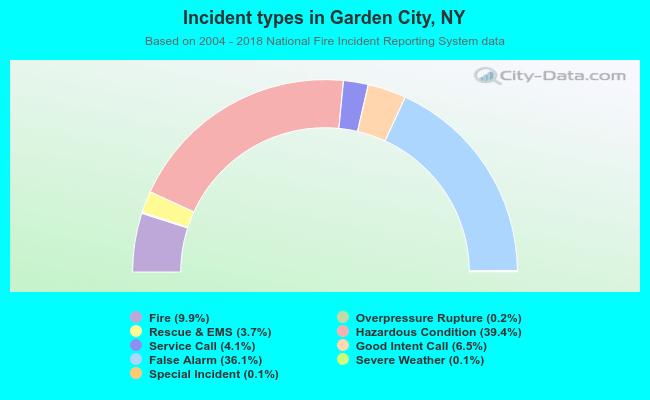 Out of all 8,027 cases reported during the years 2004 - 2018, the most belonged to the categories: Hazardous Condition (39.4%), False Alarm (36.1%), and Fire (9.9%).
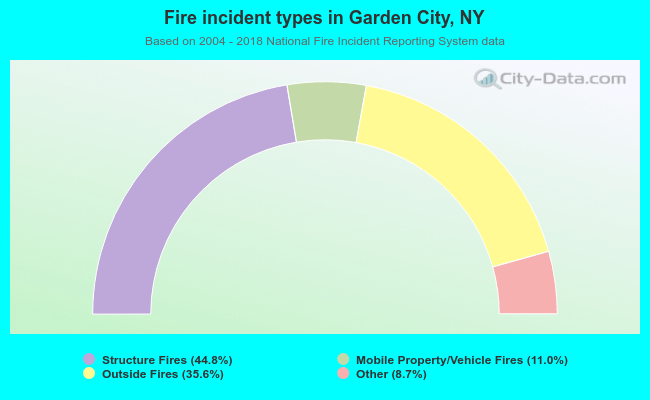 When looking into fire subcategories, the most reports belonged to: Structure Fires (44.8%), and Outside Fires (35.6%).