Baldwin: Fire Incidents, New York (NY)
Where are fire incidents reported in Baldwin, NY
Something went wrong! Please refresh the page.
|
| |||||||||||||||||||||||||||||||||||||||||||||||||||||||||||||||||||||||||||||||||||||||||||||||||||||||||||||
2002 - 2018 National Fire Incident Reporting System (NFIRS) incidents
- Incident types reported to NFIRS in Baldwin, NY
- 6,06553.8%Rescue & EMS
- 1,75615.6%False Alarm
- 1,65614.7%Hazardous Condition
- 8497.5%Fire
- 6105.4%Good Intent Call
- 2912.6%Service Call
- 290.3%Overpressure Rupture
- 120.1%Special Incident
- Fire incident types reported to NFIRS in Baldwin, NY
- 36042.4%Structure Fires
- 30836.3%Outside Fires
- 10912.8%Mobile Property/Vehicle Fires
- 728.5%Other
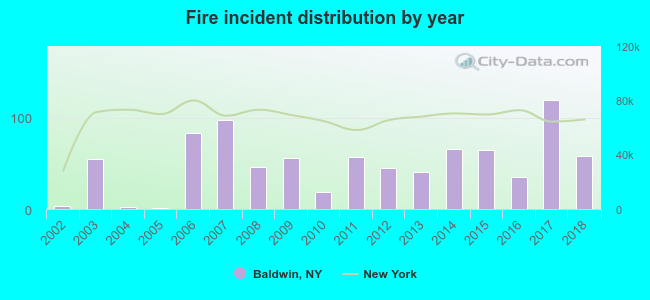 Based on the data from the years 2002 - 2018 the average number of fires per year is 50. The highest number of reported fires - 119 took place in 2017, and the least - 1 in 2005. The data has a rising trend.
The average number of yearly fire incidents per 10k residents in Baldwin, NY compared to nearest cities:
(Note: Based on data for the last 3 years, including only cities with population 5,000 and above)
| Baldwin: | 29.4 |
| Rockville Centre: | 19.6 |
| Freeport: | 20.8 |
| Roosevelt: | 39.4 |
| Oceanside: | 8.7 |
| Lakeview: | 6.5 |
| Hempstead: | 31.0 |
| Uniondale: | 5.1 |
| Merrick: | 13.0 |
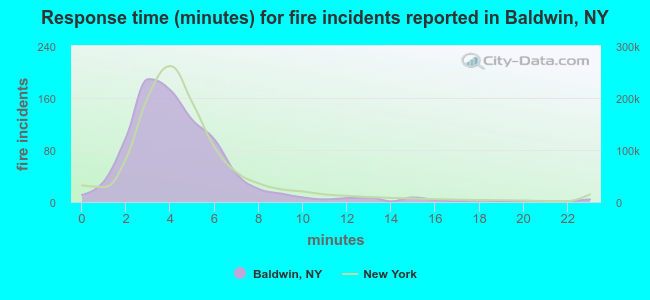 The median response time based on all reported fire incidents is 4 minutes. This is about the same as the New York median value.
The median response time in Baldwin, NY compared to nearest cities:
(Note: Based on data for all years, including only cities with at least 500 fire incidents)
| Baldwin: | 4 minutes |
| Freeport: | 3 minutes |
| Oceanside: | 4 minutes |
| Hempstead: | 3 minutes |
| West Hempstead: | 0 minutes |
| Lynbrook: | 3 minutes |
| Franklin Square: | 4 minutes |
| Garden City: | 3 minutes |
| Valley Stream: | 4 minutes |
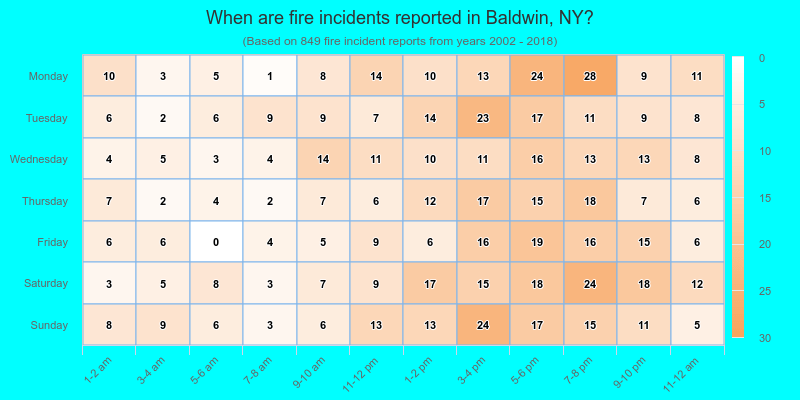
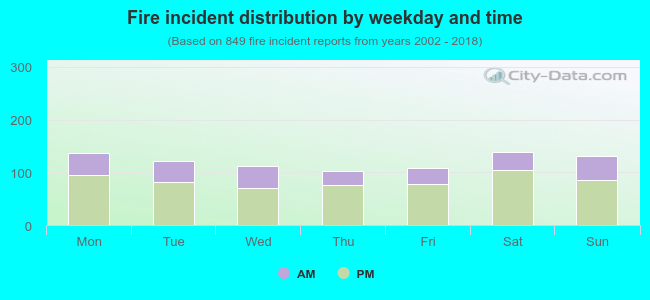 30.5% incidents where reported in the morning and 69.5% in the evening. The most fires (16.4%) took place on Saturday, and the least (12.1%) on Thursday.
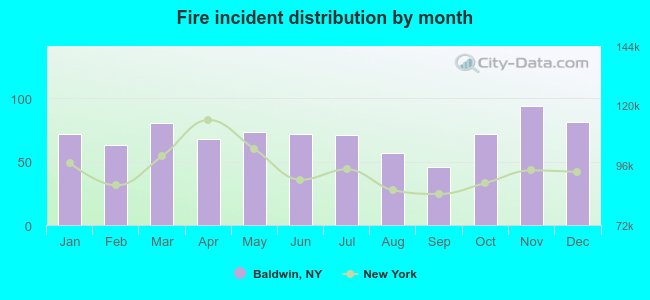 Based on the 849 fires from years 2002 - 2018 most fires (11.1%) took place during November, and the least (5.4%) in September.
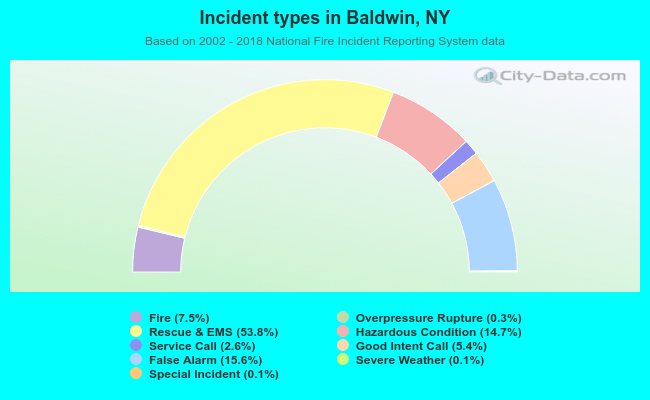 Out of all 11,275 cases reported during the years 2002 - 2018, the most belonged to the categories: Rescue & EMS (53.8%), False Alarm (15.6%), and Hazardous Condition (14.7%).
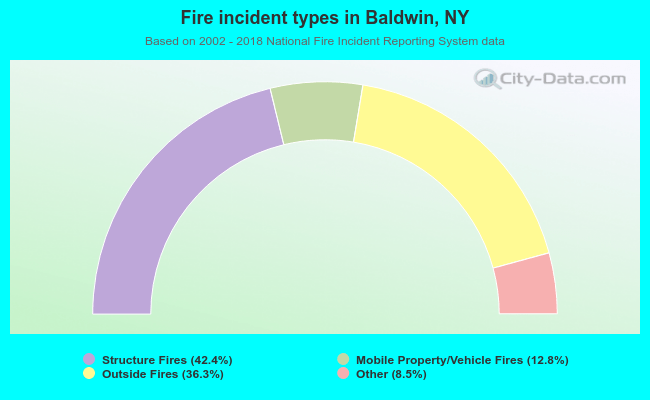 When looking into fire subcategories, the most reports belonged to: Structure Fires (42.4%), and Outside Fires (36.3%).