Gainesville: Fire Incidents, Georgia (GA)
Where are fire incidents reported in Gainesville, GA
Something went wrong! Please refresh the page.
| Fire incidents reported | |
|---|---|
| Sreet name | Count |
| BROWNS BRIDGE RD | 318 |
| THOMPSON BRIDGE RD | 232 |
| DAWSONVILLE HWY | 214 |
| JESSE JEWELL PKY | 188 |
| ATLANTA HWY | 146 |
| CANDLER RD | 130 |
| ATHENS HIGHWAY SR 129 | 100 |
| GILLSVILLE HIGHWAY SR 323 | 96 |
| INDUSTRIAL BLVD | 88 |
| MOUNTAIN VIEW RD | 88 |
| CLEVELAND HIGHWAY SR 129 | 86 |
| LENOX PARK PL | 86 |
| SHALLOWFORD RD | 86 |
| MONROE DR | 84 |
| MCEVER RD | 76 |
| WHITE SULPHUR RD | 76 |
| ATHENS ST | 74 |
| WEST RIDGE RD | 74 |
| PRICE ROAD SR 136 | 72 |
| MEMORIAL PARK DR | 70 |
| PARKHILL DR | 70 |
| BAKER RD | 68 |
| INTERSTATE 985 | 68 |
| PEARL NIX PKY | 68 |
| DAVIS ST | 66 |
| RIVERSIDE DR | 64 |
| WASHINGTON ST | 64 |
| ATHENS HIGHWAY SR 129 HWY | 62 |
| LIMESTONE PKY | 62 |
| OLD CORNELIA HWY | 62 |
| Other | 4,138 |
2002 - 2018 National Fire Incident Reporting System (NFIRS) incidents
- Incident types reported to NFIRS in Gainesville, GA
- 67,13463.3%Rescue & EMS
- 14,21713.4%Good Intent Call
- 9,7559.2%Service Call
- 7,1766.8%Fire
- 3,8573.6%False Alarm
- 3,7873.6%Hazardous Condition
- Fire incident types reported to NFIRS in Gainesville, GA
- 3,19344.5%Outside Fires
- 2,62936.6%Structure Fires
- 1,31718.4%Mobile Property/Vehicle Fires
- 370.5%Other
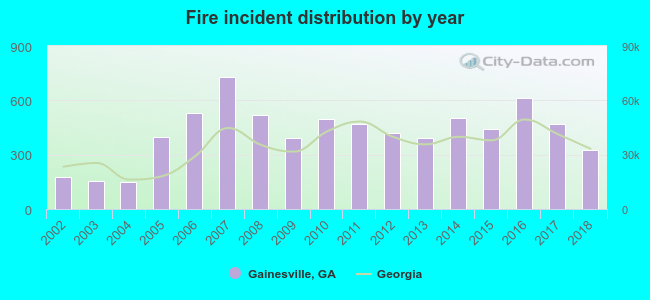 According to the data from the years 2002 - 2018 the average number of fires per year is 422. The highest number of reported fires - 731 took place in 2007, and the least - 151 in 2004. The data has a rising trend.
The average number of yearly fire incidents per 10k residents in Gainesville, GA compared to nearest cities:
(Note: Based on data for the last 3 years, including only cities with population 5,000 and above)
| Gainesville: | 129.7 |
| Murrayville: | 14.2 |
| Flowery Branch: | 122.7 |
| Braselton: | 46.2 |
| Buford: | 165.8 |
| Dahlonega: | 165.7 |
| Sugar Hill: | 0.5 |
| Jefferson: | 133.8 |
| Cumming: | 582.4 |
 The median response time based on all reported fire incidents is 6 minutes. This is close to the Georgia median value.
The median response time in Gainesville, GA compared to nearest cities:
(Note: Based on data for all years, including only cities with at least 500 fire incidents)
| Gainesville: | 6 minutes |
| Flowery Branch: | 7 minutes |
| Buford: | 8 minutes |
| Dahlonega: | 9 minutes |
| Dawsonville: | 8 minutes |
| Jefferson: | 8 minutes |
| Cumming: | 7 minutes |
| Auburn: | 7 minutes |
| Cleveland: | 9 minutes |
 According to the data from the years 2002 - 2018 the average number of fire-related fatalities per year is 1. The highest number of reported deaths - 4 took place in 2004, and the lowest - 0 in 2003. The data has a constant trend.
The average number of fatalities per 1,000 fire incidents is 3. This indicator was the highest - 26 in 2004, and the lowest 0 in 2003. The trend for deaths per 1,000 fires is declining. Compared to the state value the number of deaths per 1,000 fire incidents is similar.
According to the data from the years 2002 - 2018 the average number of fire-related fatalities per year is 1. The highest number of reported deaths - 4 took place in 2004, and the lowest - 0 in 2003. The data has a constant trend.
The average number of fatalities per 1,000 fire incidents is 3. This indicator was the highest - 26 in 2004, and the lowest 0 in 2003. The trend for deaths per 1,000 fires is declining. Compared to the state value the number of deaths per 1,000 fire incidents is similar.Deaths per 1,000 incidents in Gainesville, GA compared to nearest cities:
(Note: Based on data for all years, including only cities with at least 2,500 fire incidents)
| Gainesville: | 2.1 |
| Buford: | 2.2 |
| Cumming: | 2.2 |
| Lawrenceville: | 2.5 |
| Alpharetta: | 0.7 |
| Loganville: | 1.2 |
| Norcross: | 2.6 |
| Roswell: | 1.2 |
| Athens: | 2.1 |
 Based on the data from the years 2002 - 2018 the average number of fire-related casualties per year is 7. The highest number of casualties - 15 took place in 2006, and the lowest - 0 in 2002. The data has a rising trend.
The average number of casualties per 1,000 fires is 17. This indicator was the highest - 53 in 2004, and the lowest 0 in 2002. The trend for injuries per 1,000 fire incidents is rising. Compared to the Georgia value the number of casualties per 1,000 incidents is higher.
Based on the data from the years 2002 - 2018 the average number of fire-related casualties per year is 7. The highest number of casualties - 15 took place in 2006, and the lowest - 0 in 2002. The data has a rising trend.
The average number of casualties per 1,000 fires is 17. This indicator was the highest - 53 in 2004, and the lowest 0 in 2002. The trend for injuries per 1,000 fire incidents is rising. Compared to the Georgia value the number of casualties per 1,000 incidents is higher.Casualties per 1,000 incidents in Gainesville, GA compared to nearest cities:
(Note: Based on data for all years, including only cities with at least 500 fire incidents)
| Gainesville: | 16.3 |
| Flowery Branch: | 11.2 |
| Buford: | 19.9 |
| Dahlonega: | 2.1 |
| Dawsonville: | 5.2 |
| Jefferson: | 9.1 |
| Cumming: | 7.6 |
| Auburn: | 6.3 |
| Cleveland: | 5.5 |
 27.4% incidents where reported in the morning and 72.6% in the evening. The most fires (16.1%) took place on Saturday, and the least (13.4%) on Wednesday.
 Based on the 7,176 fires from years 2002 - 2018 most fires (10.4%) took place during March, and the least (6.4%) in September.
 Out of all 106,085 cases reported during the years 2002 - 2018, the most belonged to the categories: Rescue & EMS (63.3%), Good Intent Call (13.4%), and Service Call (9.2%).
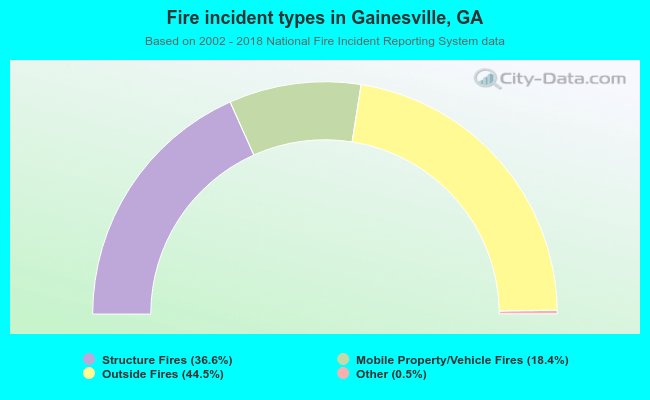 When looking into fire subcategories, the most reports belonged to: Outside Fires (44.5%), and Structure Fires (36.6%).