Franklin: Fire Incidents, Virginia (VA)
Where are fire incidents reported in Franklin, VA
Something went wrong! Please refresh the page.
| Fire incidents reported | |
|---|---|
| Sreet name | Count |
| ARMORY DR | 144 |
| PRETLOW ST | 92 |
| SOUTH ST | 88 |
| CLAY ST | 74 |
| COLLEGE DR | 74 |
| HIGH ST | 74 |
| DELAWARE RD | 72 |
| UNION CAMP DR | 72 |
| CARRSVILLE HWY | 70 |
| BRUCE ST | 62 |
| GENERAL THOMAS HWY | 58 |
| FOREST PINE RD | 54 |
| DORCHESTER ST | 52 |
| CAMERON ST | 48 |
| SMITHS FERRY RD | 48 |
| FAIRVIEW DR | 46 |
| RAILROAD AVE | 46 |
| SECOND AVE | 46 |
| MONROE RD | 44 |
| SMITHFERRY RD | 44 |
| THOMAS ST | 44 |
| MAIN ST | 38 |
| MORTON ST | 38 |
| SCHOOLHOUSE RD | 38 |
| DORCHESTER SQ | 34 |
| WALTERS HWY | 32 |
| DARDEN ST | 30 |
| WALNUT ST | 30 |
| ROSE VALLEY RD | 28 |
| ARMORY DRIV | 26 |
| Other | 634 |
2002 - 2018 National Fire Incident Reporting System (NFIRS) incidents
- Incident types reported to NFIRS in Franklin, VA
- 8,87561.2%Rescue & EMS
- 2,28015.7%Fire
- 9776.7%Hazardous Condition
- 9456.5%Good Intent Call
- 6564.5%Service Call
- 5854.0%False Alarm
- 1190.8%Special Incident
- 460.3%Overpressure Rupture
- 190.1%Severe Weather
- Fire incident types reported to NFIRS in Franklin, VA
- 1,05246.1%Structure Fires
- 72131.6%Outside Fires
- 35315.5%Mobile Property/Vehicle Fires
- 1546.8%Other
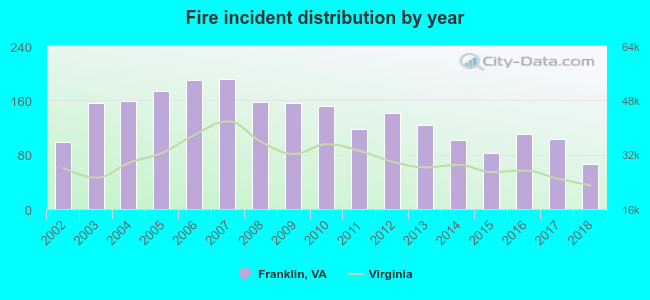 According to the data from the years 2002 - 2018 the average number of fire incidents per year is 134. The highest number of fire incidents - 191 took place in 2007, and the least - 66 in 2018. The data has a dropping trend.
The average number of yearly fire incidents per 10k residents in Franklin, VA compared to nearest cities:
(Note: Based on data for the last 3 years, including only cities with population 5,000 and above)
| Franklin: | 109.5 |
| Suffolk: | 23.3 |
| Smithfield: | 57.1 |
| Emporia: | 125.1 |
| Portsmouth: | 39.2 |
| Chesapeake: | 18.5 |
| Newport News: | 28.0 |
| Meadowbrook: | 8.5 |
| Brambleton: | 3.6 |
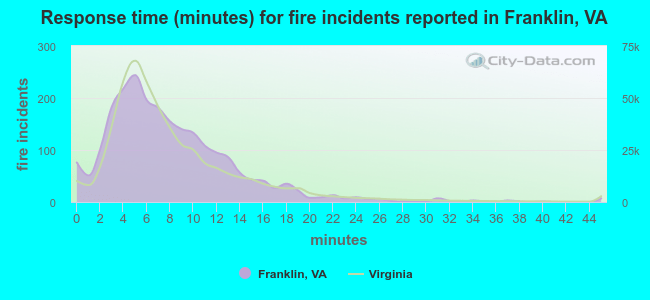 The median response time based on all reported fire incidents is 7 minutes. This is about the same as the Virginia median value.
The median response time in Franklin, VA compared to nearest cities:
(Note: Based on data for all years, including only cities with at least 500 fire incidents)
| Franklin: | 7 minutes |
| Courtland: | 11 minutes |
| Suffolk: | 6 minutes |
| Waverly: | 9 minutes |
| Ahoskie: | 6 minutes |
| Smithfield: | 7 minutes |
| Emporia: | 8 minutes |
| Portsmouth: | 5 minutes |
| Chesapeake: | 7 minutes |
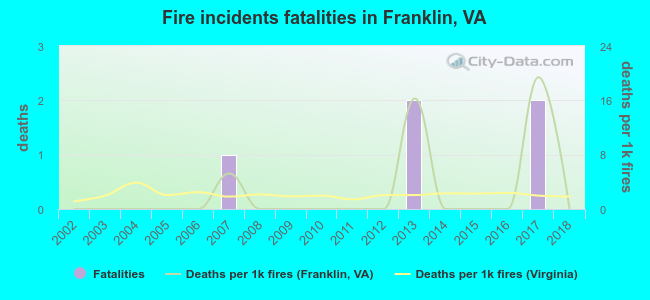 Based on the reports from the years 2002 - 2018 the average number of fire-related fatalities per year is 0. The highest number of deaths - 2 took place in 2013, and the lowest - 0 in 2002. The data has a constant trend.
 Based on the data from the years 2002 - 2018 the average number of fire-related yearly casualties is 1. The highest number of reported injuries - 4 took place in 2006, and the lowest - 0 in 2002. The data has a constant trend.
The average number of casualties per 1,000 fire incidents is 5. This indicator was the highest - 21 in 2006, and the lowest 0 in 2002. The trend for injuries per 1,000 fires is constant. Compared to the state value the number of injuries per 1,000 fire incidents is much lower.
Based on the data from the years 2002 - 2018 the average number of fire-related yearly casualties is 1. The highest number of reported injuries - 4 took place in 2006, and the lowest - 0 in 2002. The data has a constant trend.
The average number of casualties per 1,000 fire incidents is 5. This indicator was the highest - 21 in 2006, and the lowest 0 in 2002. The trend for injuries per 1,000 fires is constant. Compared to the state value the number of injuries per 1,000 fire incidents is much lower.Casualties per 1,000 incidents in Franklin, VA compared to nearest cities:
(Note: Based on data for all years, including only cities with at least 500 fire incidents)
| Franklin: | 6.1 |
| Courtland: | 0.0 |
| Suffolk: | 5.5 |
| Waverly: | 0.0 |
| Ahoskie: | 15.9 |
| Smithfield: | 4.9 |
| Emporia: | 0.0 |
| Portsmouth: | 3.9 |
| Chesapeake: | 37.9 |
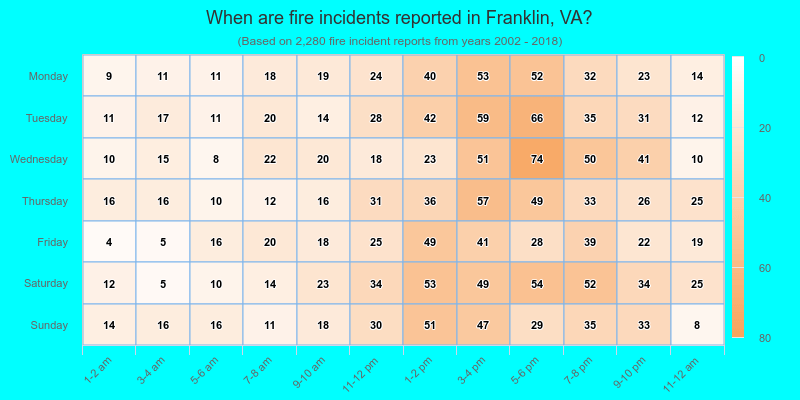
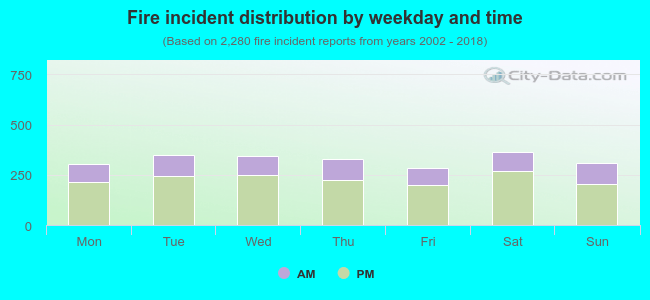 29.7% incidents where reported in the morning and 70.3% in the evening. The most fires (16.0%) took place on Saturday, and the least (12.5%) on Friday.
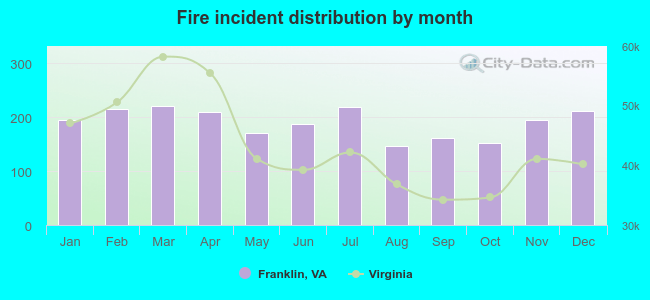 According to the 2,280 fire incidents from years 2002 - 2018 most fires (9.7%) took place during March, and the least (6.4%) in August.
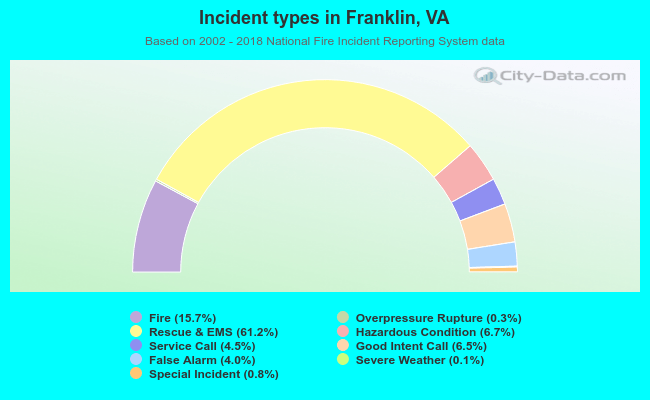 Out of all 14,502 cases reported during the years 2002 - 2018, the most belonged to the categories: Rescue & EMS (61.2%), Fire (15.7%), and Hazardous Condition (6.7%).
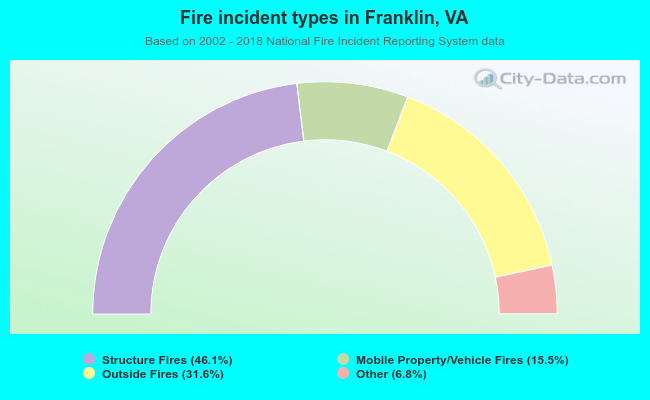 When looking into fire subcategories, the most incidents belonged to: Structure Fires (46.1%), and Outside Fires (31.6%).