Fall River: Fire Incidents, Massachusetts (MA)
Where are fire incidents reported in Fall River, MA
Something went wrong! Please refresh the page.
| Fire incidents reported | |
|---|---|
| Sreet name | Count |
| NORTH MAIN ST | 926 |
| SOUTH MAIN ST | 464 |
| PLEASANT ST | 454 |
| ROBESON ST | 362 |
| HIGHLAND AVE | 358 |
| PLYMOUTH AVE | 344 |
| PRESIDENT AVE | 302 |
| RODMAN ST | 250 |
| BEDFORD ST | 218 |
| QUEQUECHAN ST | 216 |
| BAY ST | 210 |
| PLEASANT VIEW | 204 |
| MAPLE GARDENS | 184 |
| STAFFORD RD | 184 |
| EASTERN AVE | 176 |
| AIRPORT RD | 174 |
| DAVOL ST | 158 |
| PINE ST | 156 |
| ROLLING GREEN DR | 156 |
| BRAYTON AVE | 150 |
| WILLIAM S CANNING BLVD | 150 |
| CANAL ST | 148 |
| GREEN ST | 136 |
| JEFFERSON ST | 136 |
| MIDDLE ST | 130 |
| COUNTY ST | 128 |
| SUNSET HILL | 126 |
| GLOBE ST | 120 |
| CHARLES ST | 112 |
| HIGH ST | 110 |
| Other | 1,570 |
2002 - 2018 National Fire Incident Reporting System (NFIRS) incidents
- Incident types reported to NFIRS in Fall River, MA
- 12,26127.3%False Alarm
- 11,36925.3%Rescue & EMS
- 8,51219.0%Fire
- 7,69717.2%Hazardous Condition
- 2,9616.6%Good Intent Call
- 1,8924.2%Service Call
- 1440.3%Special Incident
- Fire incident types reported to NFIRS in Fall River, MA
- 4,23949.8%Structure Fires
- 2,78032.7%Outside Fires
- 1,16313.7%Mobile Property/Vehicle Fires
- 3303.9%Other
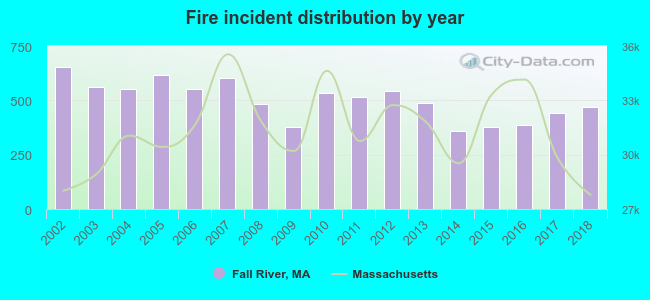 Based on the data from the years 2002 - 2018 the average number of fires per year is 501. The highest number of fires - 652 took place in 2002, and the least - 361 in 2014. The data has a dropping trend.
The average number of yearly fire incidents per 10k residents in Fall River, MA compared to nearest cities:
(Note: Based on data for the last 3 years, including only cities with population 5,000 and above)
| Fall River: | 48.8 |
| Somerset: | 22.0 |
| Swansea: | 42.2 |
| Westport: | 41.0 |
| Freetown: | 4.5 |
| Berkley: | 25.0 |
| Dighton: | 12.7 |
| Dartmouth: | 22.3 |
| Rehoboth: | 33.9 |
 The median response time based on all reported fire incidents is 5 minutes. This is higher compared to the state median value.
The median response time in Fall River, MA compared to nearest cities:
(Note: Based on data for all years, including only cities with at least 500 fire incidents)
| Fall River: | 5 minutes |
| Somerset: | 6 minutes |
| Swansea: | 7 minutes |
| Westport: | 5 minutes |
| Dartmouth: | 6 minutes |
| Rehoboth: | 6 minutes |
| New Bedford: | 4 minutes |
| Lakeville: | 6 minutes |
| Seekonk: | 6 minutes |
 Based on the reports from the years 2002 - 2018 the average number of fire-related fatalities per year is 1. The highest number of deaths - 6 took place in 2006, and the lowest - 0 in 2004. The data has a constant trend.
The average number of fatalities per 1,000 fire incidents is 3. This indicator was the highest - 11 in 2006, and the lowest 0 in 2004. The trend for fatalities per 1,000 fires is rising. Compared to the Massachusetts value the number of fatalities per 1,000 incidents is higher.
Based on the reports from the years 2002 - 2018 the average number of fire-related fatalities per year is 1. The highest number of deaths - 6 took place in 2006, and the lowest - 0 in 2004. The data has a constant trend.
The average number of fatalities per 1,000 fire incidents is 3. This indicator was the highest - 11 in 2006, and the lowest 0 in 2004. The trend for fatalities per 1,000 fires is rising. Compared to the Massachusetts value the number of fatalities per 1,000 incidents is higher.Deaths per 1,000 incidents in Fall River, MA compared to nearest cities:
(Note: Based on data for all years, including only cities with at least 2,500 fire incidents)
| Fall River: | 2.6 |
| New Bedford: | 2.2 |
| Taunton: | 3.0 |
 Based on the reports from the years 2002 - 2018 the average number of fire-related yearly casualties is 13. The highest number of reported casualties - 21 took place in 2006, and the lowest - 6 in 2005. The data has a rising trend.
The average number of injuries per 1,000 fires is 26. This indicator was the highest - 38 in 2006, and the lowest 10 in 2005. The trend for casualties per 1,000 fire incidents is growing. Compared to the state value the number of casualties per 1,000 fires is much higher.
Based on the reports from the years 2002 - 2018 the average number of fire-related yearly casualties is 13. The highest number of reported casualties - 21 took place in 2006, and the lowest - 6 in 2005. The data has a rising trend.
The average number of injuries per 1,000 fires is 26. This indicator was the highest - 38 in 2006, and the lowest 10 in 2005. The trend for casualties per 1,000 fire incidents is growing. Compared to the state value the number of casualties per 1,000 fires is much higher.
 30.8% incidents where reported in the morning and 69.2% in the evening. The most fires (15.4%) took place on Saturday, and the least (13.3%) on Wednesday.
 According to the 8,512 reports from years 2002 - 2018 most fires (11.7%) took place during July, and the least (5.7%) in February.
 Out of all 44,878 cases reported during the years 2002 - 2018, the most belonged to the categories: False Alarm (27.3%), Rescue & EMS (25.3%), and Fire (19.0%).
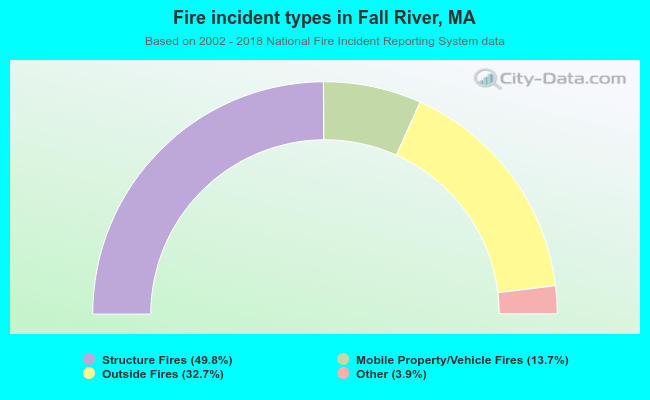 When looking into fire subcategories, the most incidents belonged to: Structure Fires (49.8%), and Outside Fires (32.7%).