Berkley: Fire Incidents, Massachusetts (MA)
Where are fire incidents reported in Berkley, MA
Something went wrong! Please refresh the page.
|
| |||||||||||||||||||||||||||||||||||||||||||||||||||||||||||||||||||||||||||||||||||||||||||||||||||||||||||||
2002 - 2018 National Fire Incident Reporting System (NFIRS) incidents
- Incident types reported to NFIRS in Berkley, MA
- 2,55060.2%Rescue & EMS
- 4119.7%Service Call
- 3688.7%Fire
- 3257.7%False Alarm
- 3187.5%Hazardous Condition
- 2515.9%Good Intent Call
- 70.2%Severe Weather
- Fire incident types reported to NFIRS in Berkley, MA
- 15642.4%Structure Fires
- 12233.2%Outside Fires
- 7720.9%Mobile Property/Vehicle Fires
- 133.5%Other
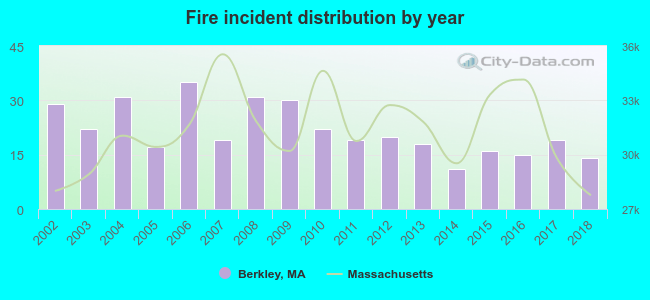 Based on the data from the years 2002 - 2018 the average number of fire incidents per year is 22. The highest number of fires - 35 took place in 2006, and the least - 11 in 2014. The data has a dropping trend.
The average number of yearly fire incidents per 10k residents in Berkley, MA compared to nearest cities:
(Note: Based on data for the last 3 years, including only cities with population 5,000 and above)
| Berkley: | 25.0 |
| Dighton: | 12.7 |
| Freetown: | 4.5 |
| Taunton: | 25.0 |
| Lakeville: | 26.4 |
| Somerset: | 22.0 |
| Raynham: | 53.8 |
| Swansea: | 42.2 |
| Rehoboth: | 33.9 |

 29.1% incidents where reported in the morning and 70.9% in the evening. The most fires (16.6%) took place on Saturday, and the least (11.7%) on Thursday.
 According to the 368 fires from years 2002 - 2018 most fires (17.9%) took place during April, and the least (3.5%) in December.
 Out of all 4,234 cases reported during the years 2002 - 2018, the most belonged to the categories: Rescue & EMS (60.2%), Service Call (9.7%), and Fire (8.7%).
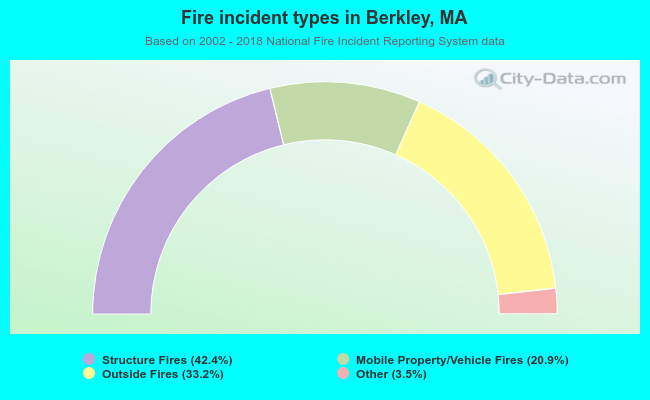 When looking into fire subcategories, the most incidents belonged to: Structure Fires (42.4%), and Outside Fires (33.2%).