Endicott: Fire Incidents, New York (NY)
Where are fire incidents reported in Endicott, NY
Something went wrong! Please refresh the page.
| Fire incidents reported | |
|---|---|
| Sreet name | Count |
| MAIN ST | 150 |
| NORTH ST | 46 |
| OAK HILL AVE | 46 |
| WASHINGTON AVE | 46 |
| ROOSEVELT AVE | 42 |
| BOSWELL HILL RD | 36 |
| BROAD ST | 36 |
| MONROE ST | 36 |
| LODER AVE | 34 |
| MCKINLEY AVE | 34 |
| ADAMS AVE | 32 |
| GLENDALE DR | 32 |
| NANTICOKE DR | 32 |
| ODELL AVE | 32 |
| HILL AVE | 30 |
| SQUIRES AVE | 30 |
| NANTICOKE AVE | 28 |
| ARTHUR AVE | 22 |
| DAY HOLLOW RD | 22 |
| FRANKLIN ST | 22 |
| NYS ROUTE 26 HWY | 22 |
| STATE RT. 17C | 22 |
| JACKSON AVE | 20 |
| LINCOLN AVE | 20 |
| NYS ROUTE 38B HWY | 20 |
| PAGE AVE | 20 |
| TRACY ST | 20 |
| JEFFERSON AVE | 18 |
| MAIN STREET | 18 |
| UNION CENTER MAINE HWY HWY | 18 |
| Other | 225 |
2002 - 2018 National Fire Incident Reporting System (NFIRS) incidents
- Incident types reported to NFIRS in Endicott, NY
- 8,44453.3%Rescue & EMS
- 2,73017.2%Hazardous Condition
- 1,4309.0%Good Intent Call
- 1,2117.6%Fire
- 9816.2%Service Call
- 9295.9%False Alarm
- 600.4%Severe Weather
- 290.2%Overpressure Rupture
- 270.2%Special Incident
- Fire incident types reported to NFIRS in Endicott, NY
- 77163.7%Structure Fires
- 28523.5%Outside Fires
- 1018.3%Mobile Property/Vehicle Fires
- 544.5%Other
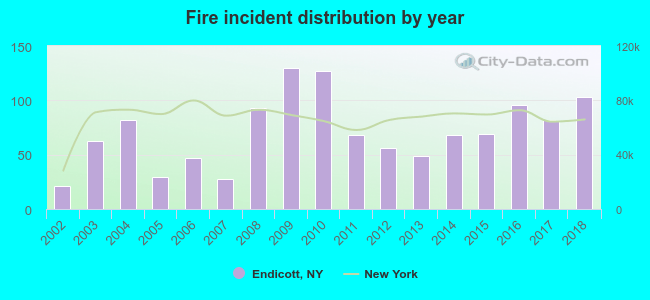 According to the data from the years 2002 - 2018 the average number of fire incidents per year is 71. The highest number of reported fire incidents - 130 took place in 2009, and the least - 21 in 2002. The data has an increasing trend.
The average number of yearly fire incidents per 10k residents in Endicott, NY compared to nearest cities:
(Note: Based on data for the last 3 years, including only cities with population 5,000 and above)
| Endicott: | 71.6 |
| Endwell: | 21.3 |
| Union: | 1.5 |
| Vestal: | 21.3 |
| Johnson City: | 42.9 |
| Maine: | 9.9 |
| Binghamton: | 52.5 |
| Dickinson: | 5.7 |
| Conklin: | 35.5 |
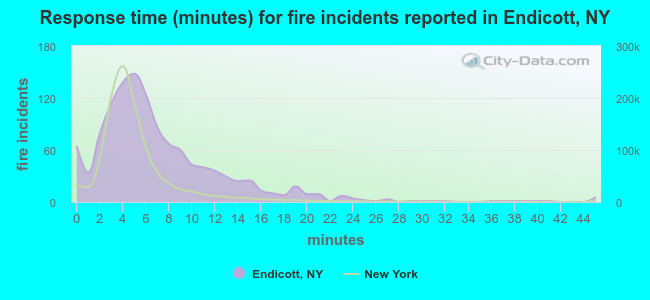 The median response time based on all reported fire incidents is 6 minutes. This is higher than the state median value.
The median response time in Endicott, NY compared to nearest cities:
(Note: Based on data for all years, including only cities with at least 500 fire incidents)
| Endicott: | 6 minutes |
| Endwell: | 6 minutes |
| Vestal: | 8 minutes |
| Johnson City: | 4 minutes |
| Binghamton: | 5 minutes |
| Owego: | 8 minutes |
| Ithaca: | 5 minutes |
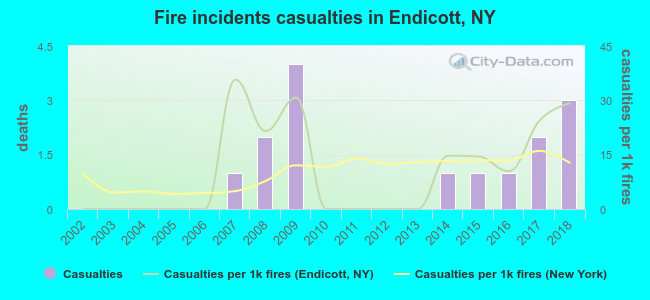 According to the data from the years 2002 - 2018 the average number of fire-related casualties per year is 1. The highest number of reported casualties - 4 took place in 2009, and the lowest - 0 in 2002. The data has a rising trend.
The average number of casualties per 1,000 fire incidents is 11. This indicator was the highest - 36 in 2007, and the lowest 0 in 2002. The trend for casualties per 1,000 incidents is growing. Compared to the state value the number of injuries per 1,000 fire incidents is higher.
According to the data from the years 2002 - 2018 the average number of fire-related casualties per year is 1. The highest number of reported casualties - 4 took place in 2009, and the lowest - 0 in 2002. The data has a rising trend.
The average number of casualties per 1,000 fire incidents is 11. This indicator was the highest - 36 in 2007, and the lowest 0 in 2002. The trend for casualties per 1,000 incidents is growing. Compared to the state value the number of injuries per 1,000 fire incidents is higher.Casualties per 1,000 incidents in Endicott, NY compared to nearest cities:
(Note: Based on data for all years, including only cities with at least 500 fire incidents)
| Endicott: | 12.4 |
| Endwell: | 10.0 |
| Vestal: | 3.8 |
| Johnson City: | 2.9 |
| Binghamton: | 7.2 |
| Owego: | 0.0 |
| Ithaca: | 22.3 |
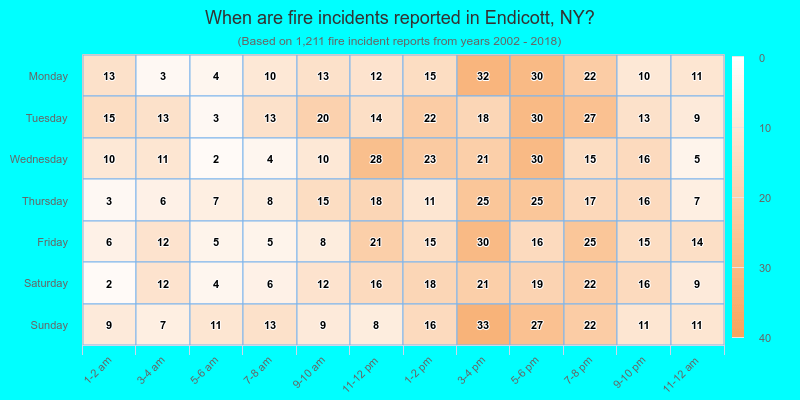
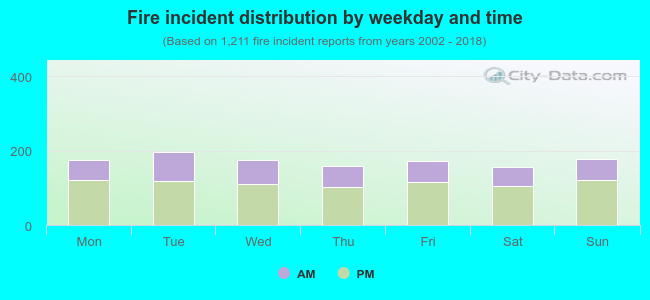 34.8% incidents where reported in the morning and 65.2% in the evening. The most fires (16.3%) took place on Tuesday, and the least (13.0%) on Saturday.
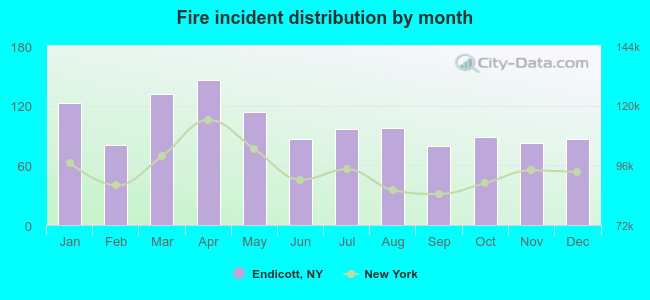 Based on the 1,211 fire incidents from years 2002 - 2018 most fires (12.1%) took place during April, and the least (6.5%) in September.
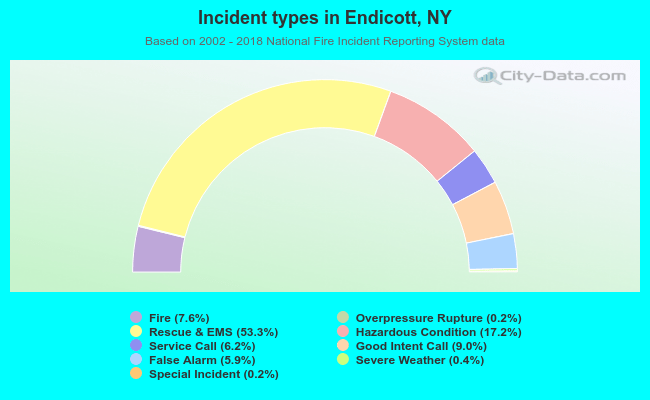 Out of all 15,841 cases reported during the years 2002 - 2018, the most belonged to the categories: Rescue & EMS (53.3%), Hazardous Condition (17.2%), and Good Intent Call (9.0%).
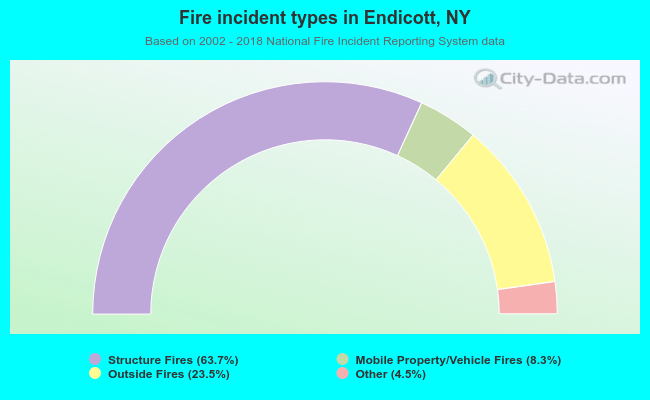 When looking into fire subcategories, the most incidents belonged to: Structure Fires (63.7%), and Outside Fires (23.5%).