Ithaca: Fire Incidents, New York (NY)
Where are fire incidents reported in Ithaca, NY
Something went wrong! Please refresh the page.
| Fire incidents reported | |
|---|---|
| Sreet name | Count |
| PLAIN ST | 256 |
| STATE ST | 160 |
| MEADOW ST | 128 |
| CAYUGA ST | 114 |
| DRYDEN RD | 112 |
| ELMIRA RD | 106 |
| MECKLENBURG RD | 102 |
| SENECA ST | 90 |
| STEWART AVE | 82 |
| COLLEGE AVE | 80 |
| DANBY RD | 76 |
| AURORA ST | 74 |
| GRANT EGBERT BLVD | 60 |
| BUFFALO ST | 54 |
| SISSON PL | 46 |
| CHESTNUT ST | 44 |
| CECIL A MALONE DR | 42 |
| UNIVERSITY AVE | 42 |
| VAN DORN RD | 42 |
| GREEN ST | 40 |
| DRYDEN RD | 36 |
| ELLIS HOLLOW RD | 36 |
| FULTON ST | 36 |
| THIRD ST | 36 |
| TRUMANSBURG RD | 36 |
| ENFIELD CENTER RD | 34 |
| HAYTS RD | 34 |
| THURSTON AVE | 34 |
| COLLEGE CIR | 32 |
| EDDY ST | 32 |
| Other | 914 |
2002 - 2018 National Fire Incident Reporting System (NFIRS) incidents
- Incident types reported to NFIRS in Ithaca, NY
- 17,27740.0%Rescue & EMS
- 9,71422.5%False Alarm
- 5,90913.7%Hazardous Condition
- 4,39310.2%Good Intent Call
- 3,0107.0%Fire
- 2,6886.2%Service Call
- 1010.2%Severe Weather
- Fire incident types reported to NFIRS in Ithaca, NY
- 1,73157.5%Structure Fires
- 73024.3%Outside Fires
- 39313.1%Mobile Property/Vehicle Fires
- 1565.2%Other
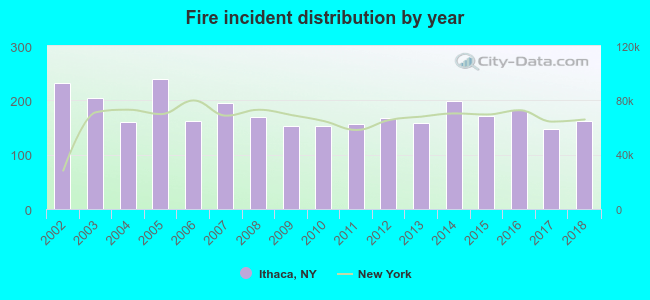 Based on the data from the years 2002 - 2018 the average number of fire incidents per year is 177. The highest number of fires - 239 took place in 2005, and the least - 147 in 2017. The data has a declining trend.
The average number of yearly fire incidents per 10k residents in Ithaca, NY compared to nearest cities:
(Note: Based on data for the last 3 years, including only cities with population 5,000 and above)
| Ithaca: | 53.4 |
| Newfield: | 10.3 |
| Cortlandville: | 20.0 |
| Cortland: | 27.7 |
| Horseheads: | 92.3 |
| Barton: | 7.5 |
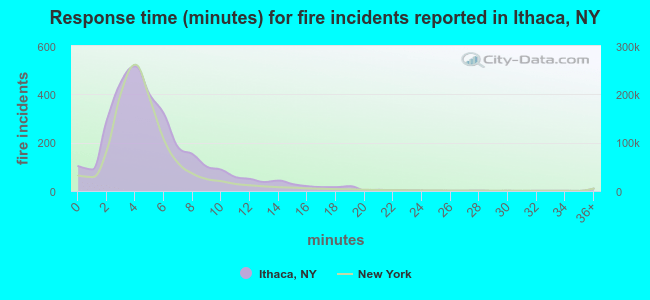 The median response time based on all reported fire incidents is 5 minutes. This is higher compared to the state median value.
The median response time in Ithaca, NY compared to nearest cities:
(Note: Based on data for all years, including only cities with at least 500 fire incidents)
| Ithaca: | 5 minutes |
| Moravia: | 11 minutes |
| Cortland: | 3 minutes |
| Homer: | 7 minutes |
| Horseheads: | 5 minutes |
| Owego: | 8 minutes |
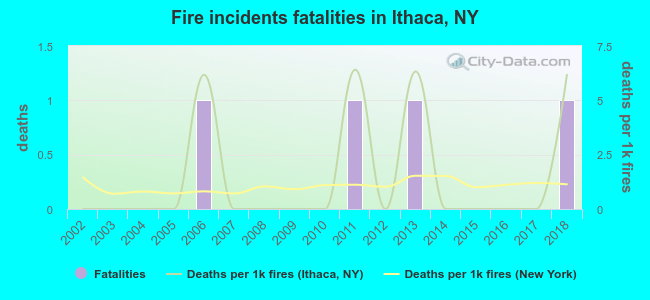 Based on the reports from the years 2002 - 2018 the average number of fire-related fatalities per year is 0. The highest number of reported deaths - 1 took place in 2006, and the lowest - 0 in 2002. The data has a rising trend.
The average number of fatalities per 1,000 fire incidents is 1. This indicator was the highest - 6 in 2011, and the lowest 0 in 2002. The trend for fatalities per 1,000 fires is increasing. Compared to the New York value the number of deaths per 1,000 fire incidents is higher.
Based on the reports from the years 2002 - 2018 the average number of fire-related fatalities per year is 0. The highest number of reported deaths - 1 took place in 2006, and the lowest - 0 in 2002. The data has a rising trend.
The average number of fatalities per 1,000 fire incidents is 1. This indicator was the highest - 6 in 2011, and the lowest 0 in 2002. The trend for fatalities per 1,000 fires is increasing. Compared to the New York value the number of deaths per 1,000 fire incidents is higher.Deaths per 1,000 incidents in Ithaca, NY compared to nearest cities:
(Note: Based on data for all years, including only cities with at least 2,500 fire incidents)
| Ithaca: | 1.3 |
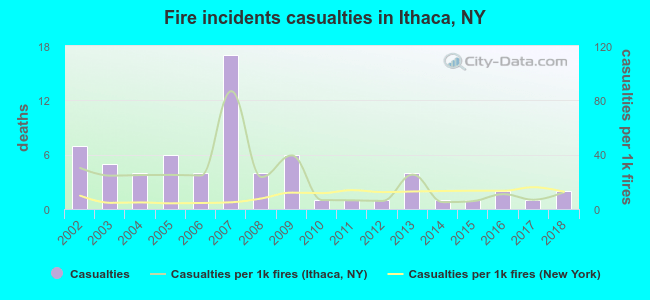 Based on the data from the years 2002 - 2018 the average number of fire-related yearly casualties is 4. The highest number of reported casualties - 17 took place in 2007, and the lowest - 1 in 2010. The data has a dropping trend.
The average number of injuries per 1,000 fires is 21. This indicator was the highest - 87 in 2007, and the lowest 5 in 2014. The trend for injuries per 1,000 incidents is decreasing. Compared to the New York value the number of injuries per 1,000 fires is much higher.
Based on the data from the years 2002 - 2018 the average number of fire-related yearly casualties is 4. The highest number of reported casualties - 17 took place in 2007, and the lowest - 1 in 2010. The data has a dropping trend.
The average number of injuries per 1,000 fires is 21. This indicator was the highest - 87 in 2007, and the lowest 5 in 2014. The trend for injuries per 1,000 incidents is decreasing. Compared to the New York value the number of injuries per 1,000 fires is much higher.Casualties per 1,000 incidents in Ithaca, NY compared to nearest cities:
(Note: Based on data for all years, including only cities with at least 500 fire incidents)
| Ithaca: | 22.3 |
| Moravia: | 0.0 |
| Cortland: | 21.3 |
| Homer: | 6.4 |
| Horseheads: | 12.9 |
| Owego: | 0.0 |
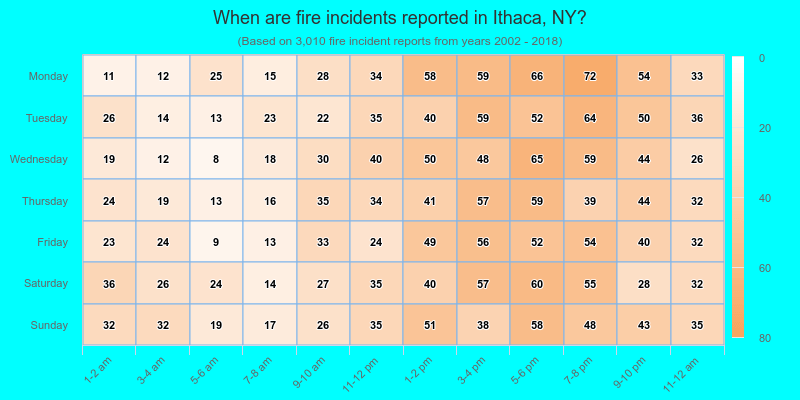
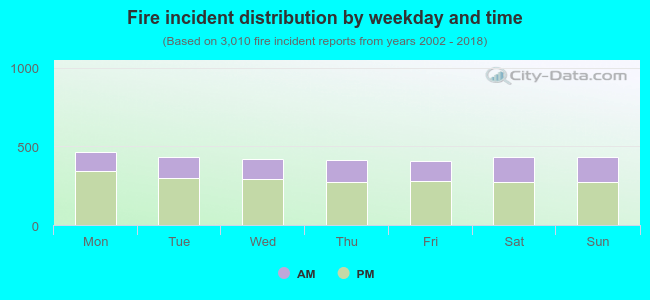 32.4% incidents where reported in the morning and 67.6% in the evening. The most fires (15.5%) took place on Monday, and the least (13.6%) on Friday.
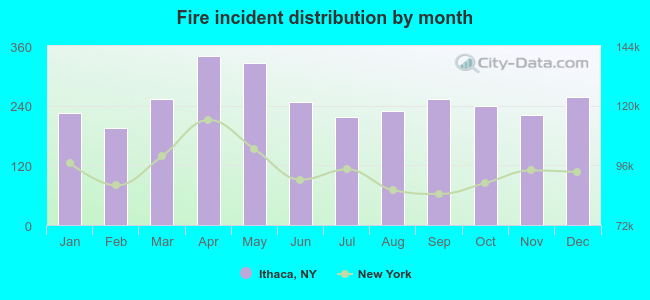 Based on the 3,010 fire incident reports from years 2002 - 2018 most fires (11.3%) took place during April, and the least (6.5%) in February.
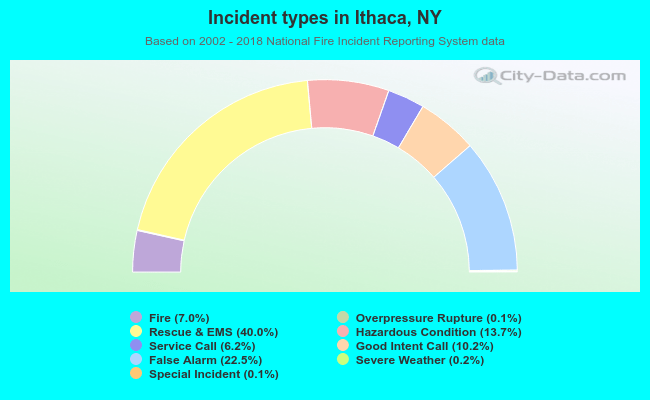 Out of all 43,164 cases reported during the years 2002 - 2018, the most belonged to the categories: Rescue & EMS (40.0%), False Alarm (22.5%), and Hazardous Condition (13.7%).
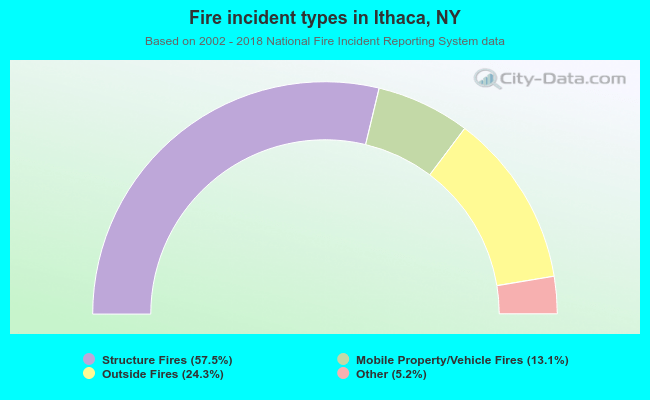 When looking into fire subcategories, the most incidents belonged to: Structure Fires (57.5%), and Outside Fires (24.3%).