Elmira: Fire Incidents, New York (NY)
Where are fire incidents reported in Elmira, NY
Something went wrong! Please refresh the page.
| Fire incidents reported | |
|---|---|
| Sreet name | Count |
| MAIN ST S | 190 |
| LAKE ST | 112 |
| MAIN ST N | 108 |
| MADISON AVE | 100 |
| WATER ST W | 98 |
| COUNTY ROUTE 64 | 92 |
| WATER ST E | 86 |
| BROADWAY | 80 |
| COLLEGE AVE | 68 |
| HOFFMAN ST | 68 |
| CHURCH ST W | 62 |
| GRAY ST W | 62 |
| SULLIVAN ST | 62 |
| WALNUT ST | 54 |
| CEDAR STREET | 52 |
| CHURCH ST E | 52 |
| PENNSYLVANIA AVE | 52 |
| CLINTON ST W | 50 |
| MAPLE AVE | 50 |
| WATER ST | 50 |
| PARK PL | 46 |
| DAVIS ST | 44 |
| SECOND ST W | 44 |
| WOODLAWN AVE | 44 |
| GROVE ST | 42 |
| MARKET ST E | 42 |
| FIRST ST W | 40 |
| CLEMENS CENTER PKWY | 38 |
| OAK ST | 38 |
| ROE AVE | 36 |
| Other | 759 |
2002 - 2018 National Fire Incident Reporting System (NFIRS) incidents
- Incident types reported to NFIRS in Elmira, NY
- 13,03250.4%Rescue & EMS
- 3,88715.0%Hazardous Condition
- 3,00911.6%False Alarm
- 2,72110.5%Fire
- 2,1668.4%Service Call
- 9343.6%Good Intent Call
- 520.2%Special Incident
- 450.2%Overpressure Rupture
- 340.1%Severe Weather
- Fire incident types reported to NFIRS in Elmira, NY
- 1,50155.2%Structure Fires
- 72226.5%Outside Fires
- 35313.0%Mobile Property/Vehicle Fires
- 1455.3%Other
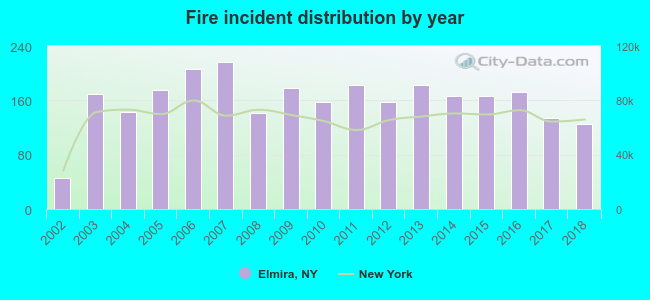 Based on the data from the years 2002 - 2018 the average number of fire incidents per year is 160. The highest number of fires - 217 took place in 2007, and the least - 46 in 2002. The data has a growing trend.
The average number of yearly fire incidents per 10k residents in Elmira, NY compared to nearest cities:
(Note: Based on data for the last 3 years, including only cities with population 5,000 and above)
| Elmira: | 50.2 |
| Southport: | 2.3 |
| Horseheads: | 92.3 |
| Big Flats: | 15.2 |
| Corning: | 44.3 |
| Barton: | 7.5 |
| Erwin: | 1.9 |
| Newfield: | 10.3 |
| Ithaca: | 53.4 |
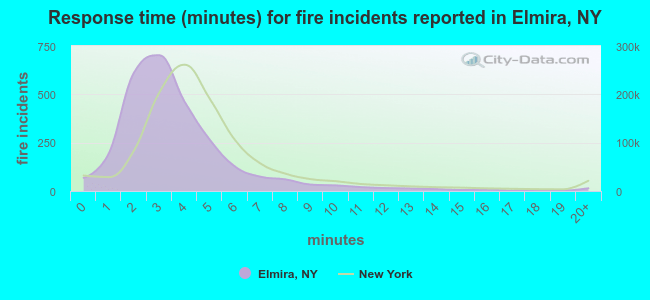 The median response time based on all reported fire incidents is 3 minutes. This is lower than the state median value.
The median response time in Elmira, NY compared to nearest cities:
(Note: Based on data for all years, including only cities with at least 500 fire incidents)
| Elmira: | 3 minutes |
| Horseheads: | 5 minutes |
| Corning: | 5 minutes |
| Owego: | 8 minutes |
| Ithaca: | 5 minutes |
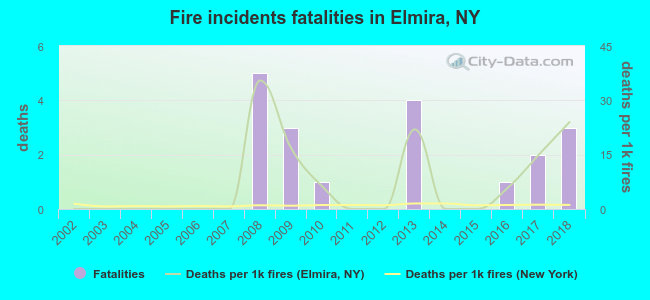 Based on the reports from the years 2002 - 2018 the average number of fire-related fatalities per year is 1. The highest number of deaths - 5 took place in 2008, and the lowest - 0 in 2002. The data has an increasing trend.
The average number of fatalities per 1,000 fires is 7. This indicator was the highest - 35 in 2008, and the lowest 0 in 2002. The trend for deaths per 1,000 incidents is growing. Compared to the New York value the number of fatalities per 1,000 fire incidents is much higher.
Based on the reports from the years 2002 - 2018 the average number of fire-related fatalities per year is 1. The highest number of deaths - 5 took place in 2008, and the lowest - 0 in 2002. The data has an increasing trend.
The average number of fatalities per 1,000 fires is 7. This indicator was the highest - 35 in 2008, and the lowest 0 in 2002. The trend for deaths per 1,000 incidents is growing. Compared to the New York value the number of fatalities per 1,000 fire incidents is much higher.Deaths per 1,000 incidents in Elmira, NY compared to nearest cities:
(Note: Based on data for all years, including only cities with at least 2,500 fire incidents)
| Elmira: | 7.0 |
| Ithaca: | 1.3 |
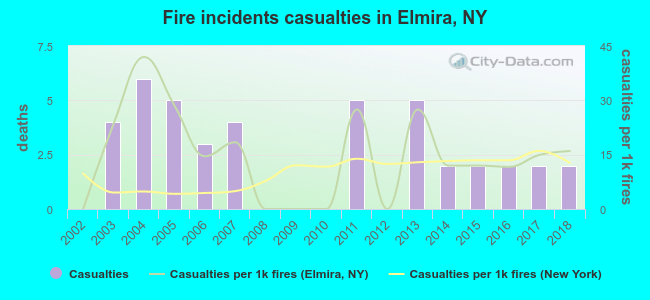 Based on the reports from the years 2002 - 2018 the average number of fire-related yearly casualties is 2. The highest number of casualties - 6 took place in 2004, and the lowest - 0 in 2002. The data has a rising trend.
The average number of casualties per 1,000 fires is 15. This indicator was the highest - 42 in 2004, and the lowest 0 in 2002. The trend for casualties per 1,000 incidents is rising. Compared to the state value the number of casualties per 1,000 fires is higher.
Based on the reports from the years 2002 - 2018 the average number of fire-related yearly casualties is 2. The highest number of casualties - 6 took place in 2004, and the lowest - 0 in 2002. The data has a rising trend.
The average number of casualties per 1,000 fires is 15. This indicator was the highest - 42 in 2004, and the lowest 0 in 2002. The trend for casualties per 1,000 incidents is rising. Compared to the state value the number of casualties per 1,000 fires is higher.Casualties per 1,000 incidents in Elmira, NY compared to nearest cities:
(Note: Based on data for all years, including only cities with at least 500 fire incidents)
| Elmira: | 15.4 |
| Horseheads: | 12.9 |
| Corning: | 20.6 |
| Owego: | 0.0 |
| Ithaca: | 22.3 |
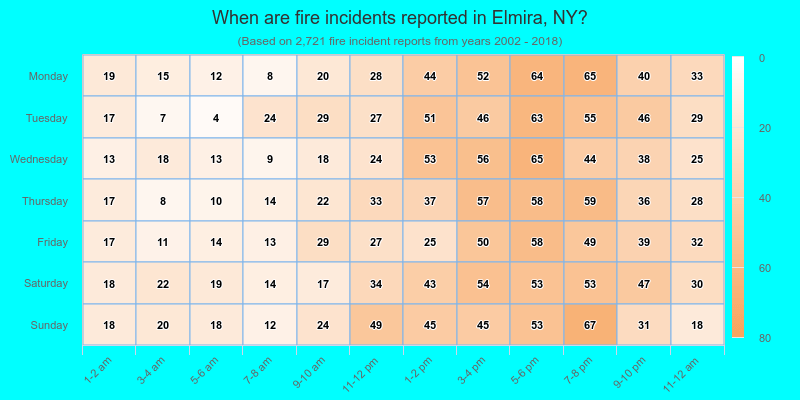
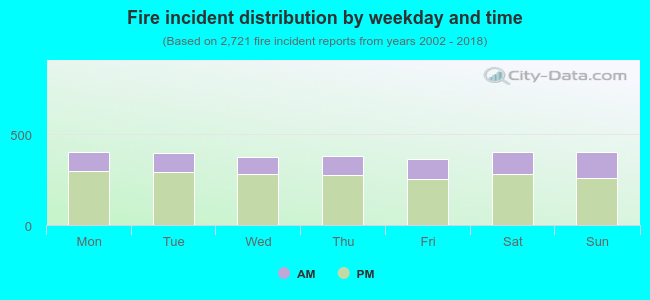 28.8% incidents where reported in the morning and 71.2% in the evening. The most fires (14.8%) took place on Saturday, and the least (13.4%) on Friday.
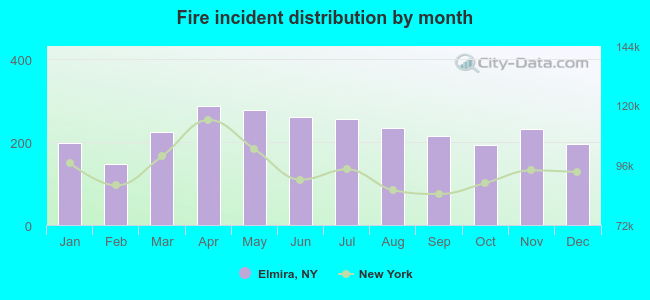 According to the 2,721 fires from years 2002 - 2018 most fires (10.6%) took place during April, and the least (5.4%) in February.
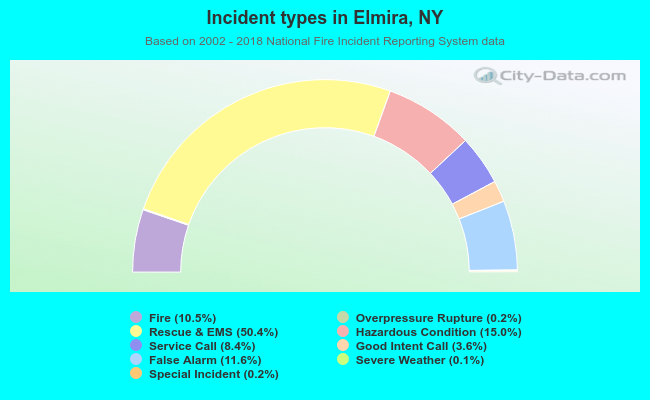 Out of all 25,880 cases reported during the years 2002 - 2018, the most belonged to the categories: Rescue & EMS (50.4%), Hazardous Condition (15.0%), and False Alarm (11.6%).
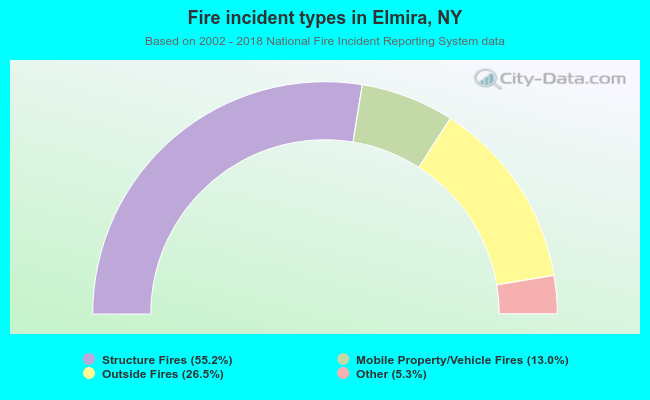 When looking into fire subcategories, the most reports belonged to: Structure Fires (55.2%), and Outside Fires (26.5%).