Elma: Fire Incidents, New York (NY)
Where are fire incidents reported in Elma, NY
Something went wrong! Please refresh the page.
|
| |||||||||||||||||||||||||||||||||||||||||||||||||||||||||||||||||||||||||||||||||||||||||||||||||||||||||||||
2002 - 2018 National Fire Incident Reporting System (NFIRS) incidents
- Incident types reported to NFIRS in Elma, NY
- 2,92459.1%Rescue & EMS
- 62112.6%Hazardous Condition
- 3937.9%Fire
- 3627.3%False Alarm
- 3166.4%Good Intent Call
- 2394.8%Service Call
- 721.5%Severe Weather
- 160.3%Special Incident
- Fire incident types reported to NFIRS in Elma, NY
- 15439.2%Structure Fires
- 10927.7%Outside Fires
- 7619.3%Other
- 5413.7%Mobile Property/Vehicle Fires
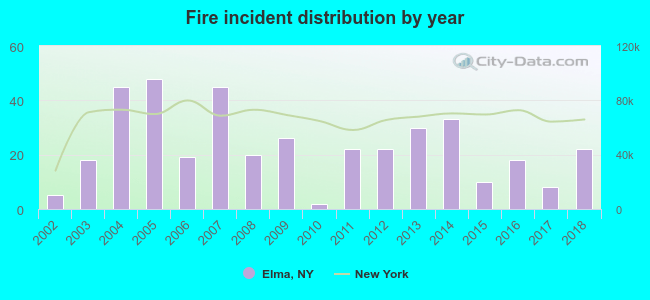 Based on the data from the years 2002 - 2018 the average number of fire incidents per year is 23. The highest number of fires - 48 took place in 2005, and the least - 2 in 2010. The data has a growing trend.
The average number of yearly fire incidents per 10k residents in Elma, NY compared to nearest cities:
(Note: Based on data for the last 3 years, including only cities with population 5,000 and above)
| Elma: | 14.1 |
| East Aurora: | 27.7 |
| Marilla: | 10.6 |
| Lancaster: | 35.0 |
| West Seneca: | 37.2 |
| Depew: | 28.7 |
| Cheektowaga: | 32.4 |
| Lackawanna: | 37.7 |
| Williamsville: | 100.3 |
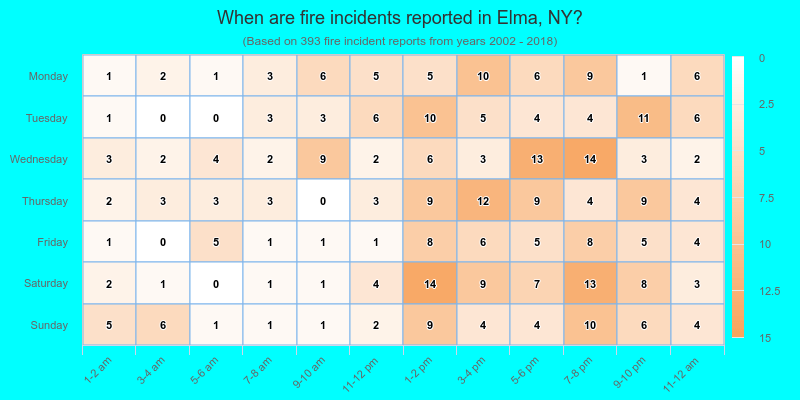
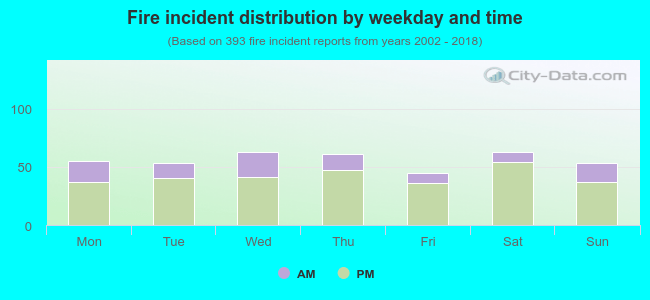 25.7% incidents where reported in the morning and 74.3% in the evening. The most fires (16.0%) took place on Wednesday, and the least (11.5%) on Friday.
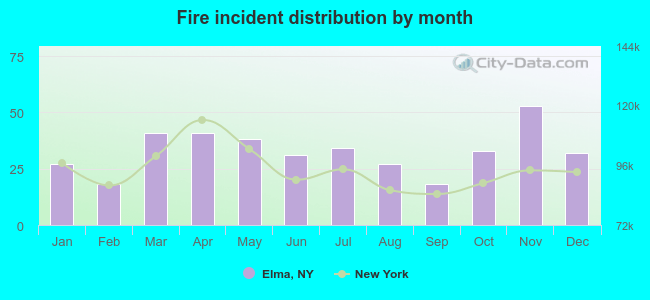 According to the 393 fire incident reports from years 2002 - 2018 most fires (13.5%) took place during November, and the least (4.6%) in February.
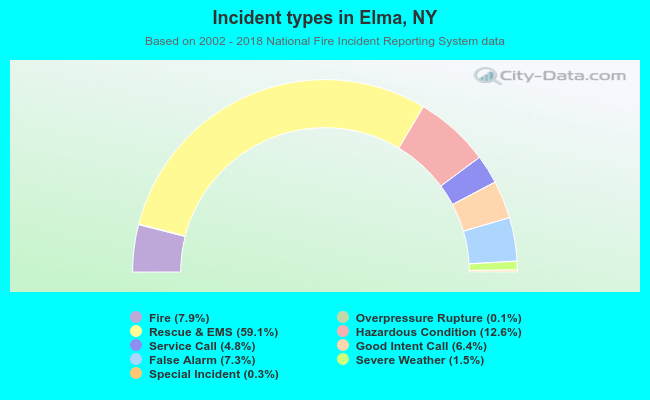 Out of all 4,947 cases reported during the years 2002 - 2018, the most belonged to the categories: Rescue & EMS (59.1%), Hazardous Condition (12.6%), and Fire (7.9%).
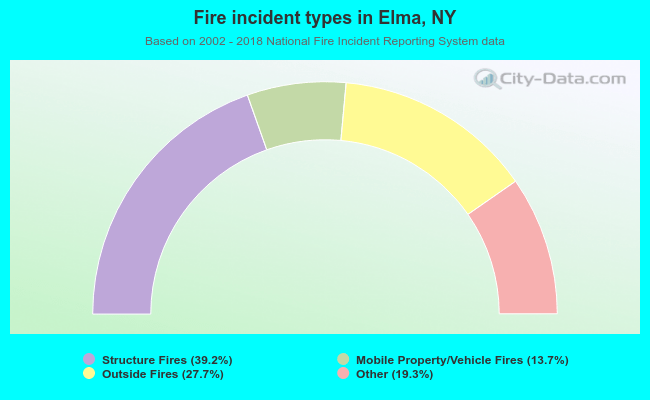 When looking into fire subcategories, the most incidents belonged to: Structure Fires (39.2%), and Outside Fires (27.7%).