Dickson: Fire Incidents, Tennessee (TN)
Where are fire incidents reported in Dickson, TN
Something went wrong! Please refresh the page.
| Fire incidents reported | |
|---|---|
| Sreet name | Count |
| 46 HWY | 344 |
| 40 INT | 278 |
| 70 HWY | 248 |
| 48 HWY | 220 |
| 40 | 110 |
| 47 HWY | 108 |
| 49 HWY | 58 |
| WALNUT ST | 58 |
| 96 HWY | 54 |
| MAIN ST | 52 |
| HENSLEE DR | 48 |
| ENO RD | 46 |
| OLD COLUMBIA RD | 46 |
| POND RD | 44 |
| BEAR CREEK RD | 42 |
| YELLOW CREEK RD | 42 |
| BEASLEY DR | 40 |
| SYLVIA RD | 38 |
| CHARLOTTE ST | 36 |
| ABIFF RD | 34 |
| PINEY | 34 |
| SPRING ST | 34 |
| COLLEGE ST | 32 |
| HARMON SPRINGS RD | 32 |
| GRAB CREEK RD | 30 |
| GUM BRANCH RD | 30 |
| I40 FWY | 30 |
| MATHIS DR | 30 |
| PINEY RD | 30 |
| HAYSHED RD | 28 |
| Other | 827 |
2004 - 2018 National Fire Incident Reporting System (NFIRS) incidents
- Incident types reported to NFIRS in Dickson, TN
- 3,08335.4%Fire
- 3,06235.2%Rescue & EMS
- 1,03411.9%Hazardous Condition
- 6777.8%False Alarm
- 5266.0%Good Intent Call
- 2372.7%Service Call
- 550.6%Special Incident
- 130.1%Overpressure Rupture
- 100.1%Severe Weather
- Fire incident types reported to NFIRS in Dickson, TN
- 1,42346.2%Outside Fires
- 82026.6%Structure Fires
- 57918.8%Mobile Property/Vehicle Fires
- 2618.5%Other
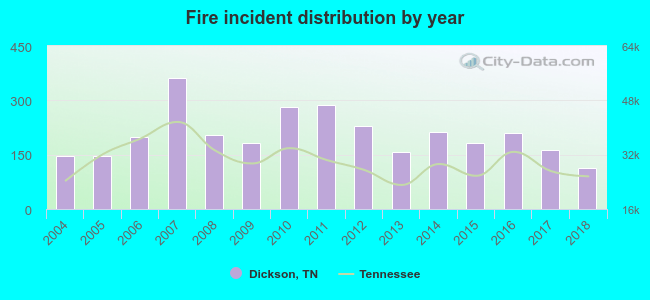 Based on the data from the years 2004 - 2018 the average number of fires per year is 205. The highest number of fires - 362 took place in 2007, and the least - 113 in 2018. The data has a dropping trend.
The average number of yearly fire incidents per 10k residents in Dickson, TN compared to nearest cities:
(Note: Based on data for the last 3 years, including only cities with population 5,000 and above)
| Dickson: | 108.3 |
| Fairview: | 28.4 |
| Franklin: | 30.3 |
| Brentwood: | 22.5 |
| Clarksville: | 41.0 |
| Spring Hill: | 17.9 |
| Columbia: | 50.7 |
| Nolensville: | 35.8 |
| Greenbrier: | 112.2 |
 The median response time based on all reported fire incidents is 6 minutes. This is about the same as the Tennessee median value.
The median response time in Dickson, TN compared to nearest cities:
(Note: Based on data for all years, including only cities with at least 500 fire incidents)
| Dickson: | 6 minutes |
| Charlotte: | 7 minutes |
| White Bluff: | 6 minutes |
| McEwen: | 9 minutes |
| Fairview: | 9 minutes |
| Ashland City: | 10 minutes |
| Waverly: | 11 minutes |
| Franklin: | 6 minutes |
| Brentwood: | 6 minutes |
 According to the reports from the years 2004 - 2018 the average number of fire-related yearly deaths is 0. The highest number of reported deaths - 1 took place in 2012, and the lowest - 0 in 2004. The data has a constant trend.
The average number of fatalities per 1,000 fires is 1. This indicator was the highest - 6 in 2017, and the lowest 0 in 2004. The trend for fatalities per 1,000 fire incidents is declining. Compared to the Tennessee value the number of deaths per 1,000 fire incidents is much lower.
According to the reports from the years 2004 - 2018 the average number of fire-related yearly deaths is 0. The highest number of reported deaths - 1 took place in 2012, and the lowest - 0 in 2004. The data has a constant trend.
The average number of fatalities per 1,000 fires is 1. This indicator was the highest - 6 in 2017, and the lowest 0 in 2004. The trend for fatalities per 1,000 fire incidents is declining. Compared to the Tennessee value the number of deaths per 1,000 fire incidents is much lower.Deaths per 1,000 incidents in Dickson, TN compared to nearest cities:
(Note: Based on data for all years, including only cities with at least 2,500 fire incidents)
| Dickson: | 1.0 |
| Franklin: | 2.5 |
| Clarksville: | 2.4 |
| Columbia: | 3.1 |
 According to the reports from the years 2004 - 2018 the average number of fire-related casualties per year is 1. The highest number of reported casualties - 4 took place in 2016, and the lowest - 0 in 2005. The data has a declining trend.
The average number of injuries per 1,000 fire incidents is 7. This indicator was the highest - 19 in 2016, and the lowest 0 in 2005. The trend for injuries per 1,000 fires is dropping. Compared to the state value the number of injuries per 1,000 fires is similar.
According to the reports from the years 2004 - 2018 the average number of fire-related casualties per year is 1. The highest number of reported casualties - 4 took place in 2016, and the lowest - 0 in 2005. The data has a declining trend.
The average number of injuries per 1,000 fire incidents is 7. This indicator was the highest - 19 in 2016, and the lowest 0 in 2005. The trend for injuries per 1,000 fires is dropping. Compared to the state value the number of injuries per 1,000 fires is similar.Casualties per 1,000 incidents in Dickson, TN compared to nearest cities:
(Note: Based on data for all years, including only cities with at least 500 fire incidents)
| Dickson: | 7.1 |
| Charlotte: | 3.3 |
| White Bluff: | 0.0 |
| McEwen: | 5.4 |
| Fairview: | 5.4 |
| Ashland City: | 6.7 |
| Waverly: | 0.0 |
| Franklin: | 12.8 |
| Brentwood: | 8.9 |
 29.6% incidents where reported in the morning and 70.4% in the evening. The most fires (16.3%) took place on Saturday, and the least (13.1%) on Wednesday.
 Based on the 3,083 fires from years 2004 - 2018 most fires (12.0%) took place during March, and the least (6.7%) in June.
 Out of all 8,697 cases reported during the years 2004 - 2018, the most belonged to the categories: Fire (35.4%), Rescue & EMS (35.2%), and Hazardous Condition (11.9%).
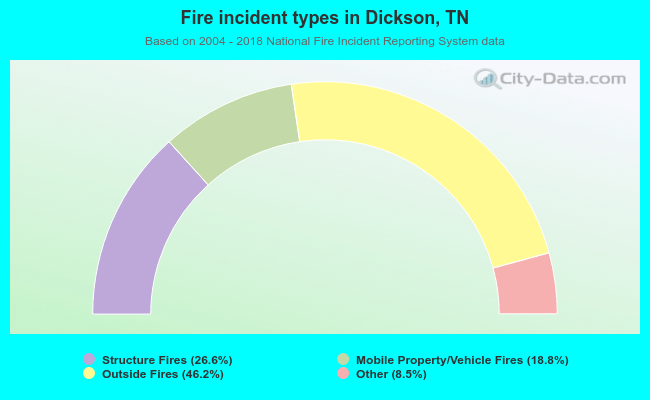 When looking into fire subcategories, the most incidents belonged to: Outside Fires (46.2%), and Structure Fires (26.6%).