Dedham: Fire Incidents, Massachusetts (MA)
Where are fire incidents reported in Dedham, MA
Something went wrong! Please refresh the page.
| Fire incidents reported | |
|---|---|
| Sreet name | Count |
| ONEIL DR | 254 |
| PROVIDENCE HWY | 254 |
| GREAT MEADOW RD | 204 |
| WASHINGTON ST | 204 |
| HIGH ST | 176 |
| PARKWAY CT | 98 |
| EAST ST | 86 |
| LEGACY PL | 78 |
| ELM ST | 76 |
| O'NEIL DR | 76 |
| DOGGETT CIR | 72 |
| BRIDGE ST | 68 |
| BUSSEY ST | 64 |
| LONGWOOD DR/FOX HILL/WSWD | 60 |
| EASTERN AV | 52 |
| MILTON ST | 50 |
| RIVER ST | 36 |
| STATION CIR | 32 |
| COMMON ST | 30 |
| SPRAGUE ST | 30 |
| ALLIED DR | 28 |
| WEST ST | 28 |
| WHITING AV | 28 |
| ASHCROFT ST | 26 |
| CAREMATRIX DR | 26 |
| ALLIED DR | 22 |
| CEDAR ST | 18 |
| WASHINGTON ST | 18 |
| COURT ST | 16 |
| GREYSTONE PATH | 16 |
2002 - 2018 National Fire Incident Reporting System (NFIRS) incidents
- Incident types reported to NFIRS in Dedham, MA
- 11,82656.4%Rescue & EMS
- 3,17015.1%Hazardous Condition
- 2,40711.5%False Alarm
- 1,8108.6%Fire
- 8764.2%Service Call
- 8093.9%Good Intent Call
- 350.2%Special Incident
- 260.1%Overpressure Rupture
- Fire incident types reported to NFIRS in Dedham, MA
- 1,04357.6%Structure Fires
- 57431.7%Outside Fires
- 1629.0%Mobile Property/Vehicle Fires
- 311.7%Other
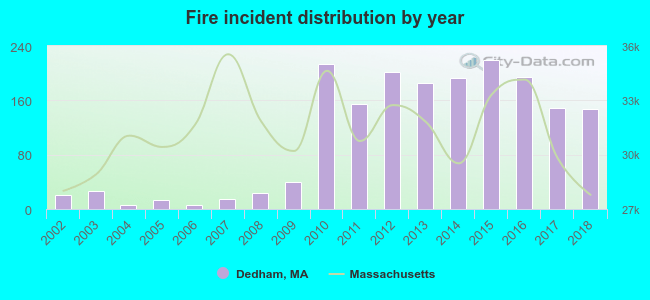 Based on the data from the years 2002 - 2018 the average number of fires per year is 106. The highest number of reported fires - 220 took place in 2015, and the least - 6 in 2004. The data has a rising trend.
The average number of yearly fire incidents per 10k residents in Dedham, MA compared to nearest cities:
(Note: Based on data for the last 3 years, including only cities with population 5,000 and above)
| Dedham: | 66.2 |
| Westwood: | 92.1 |
| Norwood: | 40.4 |
| Needham: | 17.8 |
| Milton: | 54.6 |
| Canton: | 29.2 |
| Brookline: | 72.0 |
| Boston: | 83.7 |
| Newton: | 29.6 |
 The median response time based on all reported fire incidents is 4 minutes. This is comparable to the Massachusetts median value.
The median response time in Dedham, MA compared to nearest cities:
(Note: Based on data for all years, including only cities with at least 500 fire incidents)
| Dedham: | 4 minutes |
| Westwood: | 5 minutes |
| Norwood: | 4 minutes |
| Needham: | 4 minutes |
| Milton: | 3 minutes |
| Canton: | 5 minutes |
| Brookline: | 3 minutes |
| Boston: | 3 minutes |
| Newton: | 5 minutes |
 Based on the reports from the years 2002 - 2018 the average number of fire-related fatalities per year is 0. The highest number of reported deaths - 1 took place in 2012, and the lowest - 0 in 2002. The data has a constant trend.
 Based on the reports from the years 2002 - 2018 the average number of fire-related casualties per year is 1. The highest number of injuries - 4 took place in 2012, and the lowest - 0 in 2003. The data has a decreasing trend.
The average number of injuries per 1,000 fire incidents is 27. This indicator was the highest - 167 in 2006, and the lowest 0 in 2003. The trend for casualties per 1,000 fire incidents is declining. Compared to the Massachusetts value the number of casualties per 1,000 incidents is lower.
Based on the reports from the years 2002 - 2018 the average number of fire-related casualties per year is 1. The highest number of injuries - 4 took place in 2012, and the lowest - 0 in 2003. The data has a decreasing trend.
The average number of injuries per 1,000 fire incidents is 27. This indicator was the highest - 167 in 2006, and the lowest 0 in 2003. The trend for casualties per 1,000 fire incidents is declining. Compared to the Massachusetts value the number of casualties per 1,000 incidents is lower.
 29.6% incidents where reported in the morning and 70.4% in the evening. The most fires (15.6%) took place on Monday, and the least (12.7%) on Thursday.
 According to the 1,810 fire incident reports from years 2002 - 2018 most fires (12.3%) took place during April, and the least (5.4%) in January.
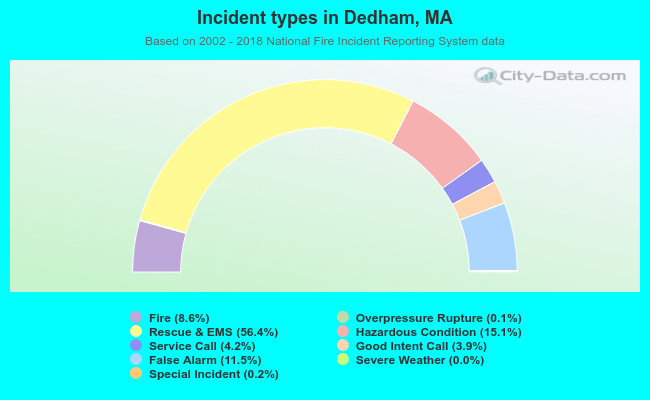 Out of all 20,963 cases reported during the years 2002 - 2018, the most belonged to the categories: Rescue & EMS (56.4%), Hazardous Condition (15.1%), and False Alarm (11.5%).
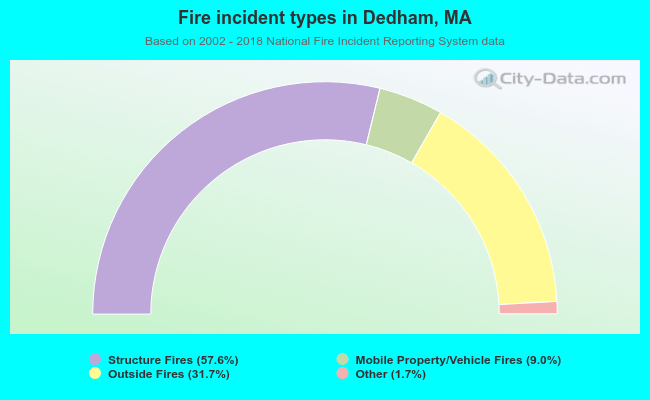 When looking into fire subcategories, the most incidents belonged to: Structure Fires (57.6%), and Outside Fires (31.7%).