Canton: Fire Incidents, Massachusetts (MA)
Where are fire incidents reported in Canton, MA
Something went wrong! Please refresh the page.
| Fire incidents reported | |
|---|---|
| Sreet name | Count |
| WASHINGTON ST | 198 |
| TURNPIKE ST | 118 |
| RANDOLPH ST | 68 |
| DAN RD | 50 |
| NEPONSET ST | 50 |
| ROUTE 95 | 40 |
| 95 | 32 |
| REVERE ST | 32 |
| JACKSON ST | 28 |
| ROUTE 93 NORTH | 26 |
| SHAWMUT RD | 26 |
| ARBORETUM WAY | 24 |
| BOLIVAR ST | 22 |
| SHERMAN ST | 20 |
| DEDHAM ST | 18 |
| DEL POND DR | 18 |
| PLEASANT ST | 18 |
| ROUTE 93 SOUTH | 18 |
| CHAPMAN ST | 16 |
| WILL DR | 14 |
| PEQUIT ST | 10 |
| WALNUT ST | 10 |
| WATERFALL DR | 10 |
| YORK ST | 10 |
| FENCOURT RD | 8 |
| HIGH ST | 8 |
| KINGS RD | 8 |
| MECHANIC ST | 8 |
| ROCKLAND ST | 8 |
| TRAYER RD | 8 |
2002 - 2018 National Fire Incident Reporting System (NFIRS) incidents
- Incident types reported to NFIRS in Canton, MA
- 4,05253.5%Rescue & EMS
- 1,01513.4%False Alarm
- 84611.2%Fire
- 80910.7%Service Call
- 4736.2%Good Intent Call
- 3504.6%Hazardous Condition
- 130.2%Special Incident
- 120.2%Severe Weather
- Fire incident types reported to NFIRS in Canton, MA
- 37043.7%Structure Fires
- 28533.7%Mobile Property/Vehicle Fires
- 10111.9%Outside Fires
- 9010.6%Other
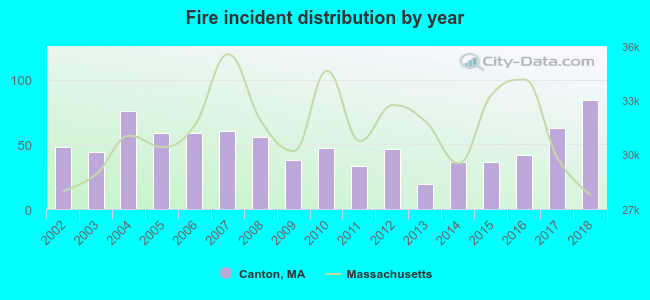 According to the data from the years 2002 - 2018 the average number of fires per year is 50. The highest number of reported fires - 84 took place in 2018, and the least - 19 in 2013. The data has an increasing trend.
The average number of yearly fire incidents per 10k residents in Canton, MA compared to nearest cities:
(Note: Based on data for the last 3 years, including only cities with population 5,000 and above)
| Canton: | 29.2 |
| Stoughton: | 44.3 |
| Norwood: | 40.4 |
| Randolph: | 60.2 |
| Sharon: | 86.6 |
| Westwood: | 92.1 |
| Dedham: | 66.2 |
| Walpole: | 123.4 |
| Holbrook: | 47.3 |
 The median response time based on all reported fire incidents is 5 minutes. This is higher compared to the state median value.
The median response time in Canton, MA compared to nearest cities:
(Note: Based on data for all years, including only cities with at least 500 fire incidents)
| Canton: | 5 minutes |
| Stoughton: | 3 minutes |
| Norwood: | 4 minutes |
| Randolph: | 3 minutes |
| Sharon: | 5 minutes |
| Avon: | 4 minutes |
| Westwood: | 5 minutes |
| Dedham: | 4 minutes |
| Walpole: | 3 minutes |
 According to the data from the years 2002 - 2018 the average number of fire-related yearly casualties is 2. The highest number of reported casualties - 5 took place in 2008, and the lowest - 0 in 2009. The data has a declining trend.
The average number of casualties per 1,000 fire incidents is 41. This indicator was the highest - 111 in 2014, and the lowest 0 in 2009. The trend for casualties per 1,000 incidents is decreasing. Compared to the Massachusetts value the number of injuries per 1,000 fires is much higher.
According to the data from the years 2002 - 2018 the average number of fire-related yearly casualties is 2. The highest number of reported casualties - 5 took place in 2008, and the lowest - 0 in 2009. The data has a declining trend.
The average number of casualties per 1,000 fire incidents is 41. This indicator was the highest - 111 in 2014, and the lowest 0 in 2009. The trend for casualties per 1,000 incidents is decreasing. Compared to the Massachusetts value the number of injuries per 1,000 fires is much higher.
 36.6% incidents where reported in the morning and 63.4% in the evening. The most fires (16.8%) took place on Friday, and the least (12.9%) on Wednesday.
 Based on the 846 fires from years 2002 - 2018 most fires (11.2%) took place during April, and the least (5.9%) in January.
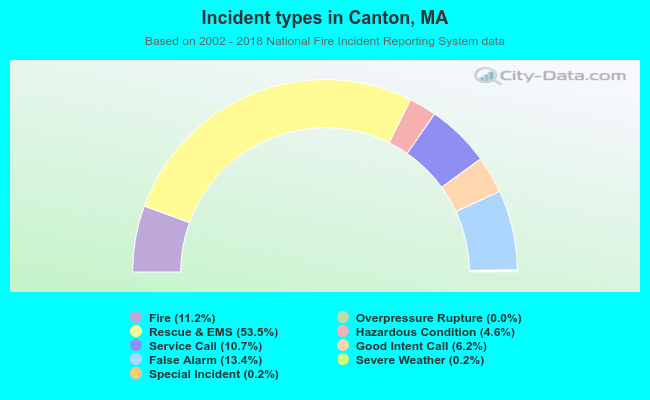 Out of all 7,571 cases reported during the years 2002 - 2018, the most belonged to the categories: Rescue & EMS (53.5%), False Alarm (13.4%), and Fire (11.2%).
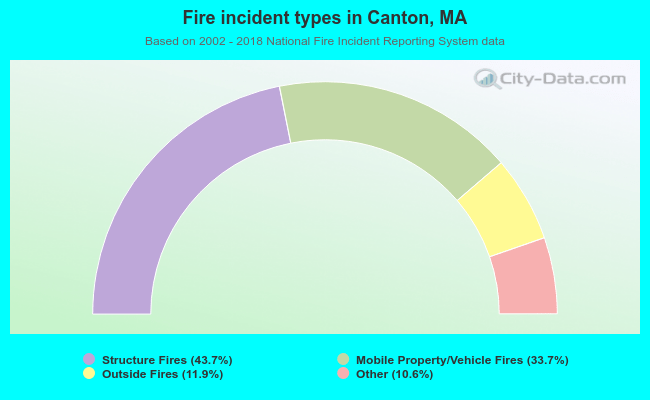 When looking into fire subcategories, the most reports belonged to: Structure Fires (43.7%), and Mobile Property/Vehicle Fires (33.7%).