Covington: Fire Incidents, Georgia (GA)
Where are fire incidents reported in Covington, GA
Something went wrong! Please refresh the page.
| Fire incidents reported | |
|---|---|
| Sreet name | Count |
| GA HWY | 376 |
| ALCOVY RD | 168 |
| BROWN BRIDGE RD | 150 |
| I 20 | 122 |
| SALEM RD | 122 |
| 278 HWY | 116 |
| INTERSTATE 20 | 116 |
| KIRKLAND RD | 110 |
| WASHINGTON ST | 108 |
| TURNER ST | 102 |
| US HWY 278 | 80 |
| ACCESS RD | 70 |
| FLAT SHOALS RD | 70 |
| CROWELL RD | 62 |
| INDUSTRIAL BLVD | 62 |
| OLD ATLANTA HWY | 62 |
| GA HWY 142 | 50 |
| COVINGTON BYPASS RD | 48 |
| GA HWY 162 | 48 |
| INDUSTRIAL PARK BLVD | 48 |
| TURNER LAKE RD | 48 |
| SETTLERS GROVE RD | 42 |
| 20 EXPY | 40 |
| EMORY ST | 40 |
| MAGNOLIA HEIGHTS CIR | 40 |
| ROCKY PLAINS RD | 40 |
| CITY POND RD | 36 |
| DIXIE RD | 36 |
| LAKESIDE CIR | 36 |
| MOUNTAINVIEW DR | 36 |
| Other | 2,460 |
2002 - 2018 National Fire Incident Reporting System (NFIRS) incidents
- Incident types reported to NFIRS in Covington, GA
- 19,24349.3%Rescue & EMS
- 6,08815.6%Good Intent Call
- 4,94412.7%Fire
- 3,7769.7%Hazardous Condition
- 2,4156.2%False Alarm
- 2,3466.0%Service Call
- 1070.3%Special Incident
- 900.2%Severe Weather
- 480.1%Overpressure Rupture
- Fire incident types reported to NFIRS in Covington, GA
- 2,05441.5%Outside Fires
- 1,79336.3%Structure Fires
- 90418.3%Mobile Property/Vehicle Fires
- 1933.9%Other
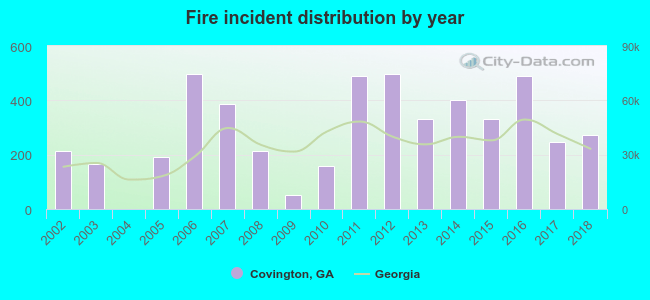 According to the data from the years 2002 - 2018 the average number of fires per year is 291. The highest number of fire incidents - 498 took place in 2006, and the least - 0 in 2004. The data has a rising trend.
The average number of yearly fire incidents per 10k residents in Covington, GA compared to nearest cities:
(Note: Based on data for the last 3 years, including only cities with population 5,000 and above)
| Covington: | 246.6 |
| Conyers: | 159.9 |
| Monroe: | 139.5 |
| Loganville: | 153.9 |
| Snellville: | 80.4 |
| McDonough: | 109.3 |
| Stockbridge: | 65.5 |
| Locust Grove: | 116.9 |
| Stone Mountain: | 481.3 |
 The median response time based on all reported fire incidents is 7 minutes. This is close to the state median value.
The median response time in Covington, GA compared to nearest cities:
(Note: Based on data for all years, including only cities with at least 500 fire incidents)
| Covington: | 7 minutes |
| Oxford: | 9 minutes |
| Conyers: | 7 minutes |
| Monroe: | 6 minutes |
| Lithonia: | 7 minutes |
| Loganville: | 7 minutes |
| Snellville: | 8 minutes |
| McDonough: | 7 minutes |
| Stockbridge: | 7 minutes |
 According to the reports from the years 2002 - 2018 the average number of fire-related casualties per year is 3. The highest number of casualties - 8 took place in 2007, and the lowest - 0 in 2003. The data has an increasing trend.
The average number of injuries per 1,000 fire incidents is 8. This indicator was the highest - 21 in 2007, and the lowest 0 in 2003. The trend for casualties per 1,000 fires is increasing. Compared to the state value the number of injuries per 1,000 incidents is about the same.
According to the reports from the years 2002 - 2018 the average number of fire-related casualties per year is 3. The highest number of casualties - 8 took place in 2007, and the lowest - 0 in 2003. The data has an increasing trend.
The average number of injuries per 1,000 fire incidents is 8. This indicator was the highest - 21 in 2007, and the lowest 0 in 2003. The trend for casualties per 1,000 fires is increasing. Compared to the state value the number of injuries per 1,000 incidents is about the same.Casualties per 1,000 incidents in Covington, GA compared to nearest cities:
(Note: Based on data for all years, including only cities with at least 500 fire incidents)
| Covington: | 8.7 |
| Oxford: | 2.0 |
| Conyers: | 14.4 |
| Monroe: | 7.8 |
| Lithonia: | 5.9 |
| Loganville: | 10.4 |
| Snellville: | 22.7 |
| McDonough: | 5.9 |
| Stockbridge: | 11.6 |
 26.0% incidents where reported in the morning and 74.0% in the evening. The most fires (15.2%) took place on Saturday, and the least (13.2%) on Friday.
 According to the 4,944 reports from years 2002 - 2018 most fires (12.4%) took place during March, and the least (5.3%) in August.
 Out of all 39,057 cases reported during the years 2002 - 2018, the most belonged to the categories: Rescue & EMS (49.3%), Good Intent Call (15.6%), and Fire (12.7%).
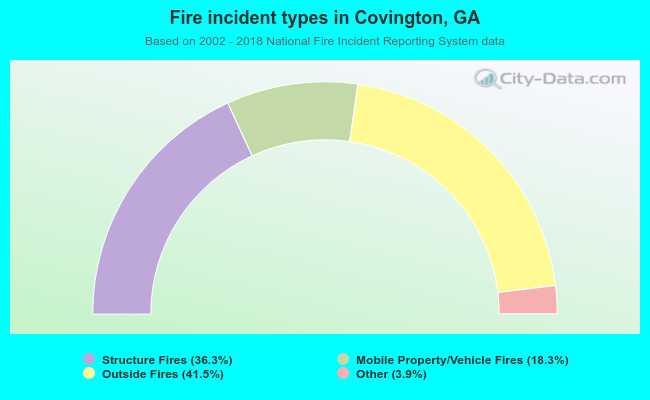 When looking into fire subcategories, the most incidents belonged to: Outside Fires (41.5%), and Structure Fires (36.3%).