Stockbridge: Fire Incidents, Georgia (GA)
Where are fire incidents reported in Stockbridge, GA
Something went wrong! Please refresh the page.
| Fire incidents reported | |
|---|---|
| Sreet name | Count |
| I75 | 302 |
| JODECO RD | 136 |
| MT ZION RD | 134 |
| INTERSTATE 75 | 124 |
| HIGHWAY 138 | 122 |
| ROCK QUARRY RD | 116 |
| HENRY BLV | 110 |
| HUDSON BRIDGE RD | 108 |
| OLD CONYERS RD | 102 |
| FAIRVIEW RD | 84 |
| EVERGREEN WAY | 76 |
| 138 HWY | 74 |
| FLIPPEN RD | 74 |
| DAVIS RD | 72 |
| UNION CHURCH RD | 72 |
| EASTWOOD VILLAGE DR | 70 |
| HIGHWAY 42 | 64 |
| HWY 138 | 62 |
| ATLANTA RD | 60 |
| FLAT ROCK RD | 60 |
| HIGHWAY 155 | 54 |
| GLENWOOD WAY | 52 |
| FOREST RD | 50 |
| NORTH HENRY BLVD | 50 |
| JONESBORO RD | 48 |
| MILLERS MILL RD | 48 |
| LAKESHORE DR | 46 |
| MAYS RD | 46 |
| EAGLES LANDING PKWY | 42 |
| ST IVES CROSSING | 40 |
| Other | 1,914 |
2002 - 2018 National Fire Incident Reporting System (NFIRS) incidents
- Incident types reported to NFIRS in Stockbridge, GA
- 31,88765.8%Rescue & EMS
- 4,4129.1%Fire
- 3,9258.1%Service Call
- 2,8305.8%Good Intent Call
- 2,6015.4%Hazardous Condition
- 2,5645.3%False Alarm
- 920.2%Special Incident
- 820.2%Severe Weather
- Fire incident types reported to NFIRS in Stockbridge, GA
- 2,15348.8%Outside Fires
- 1,33330.2%Structure Fires
- 80918.3%Mobile Property/Vehicle Fires
- 1172.7%Other
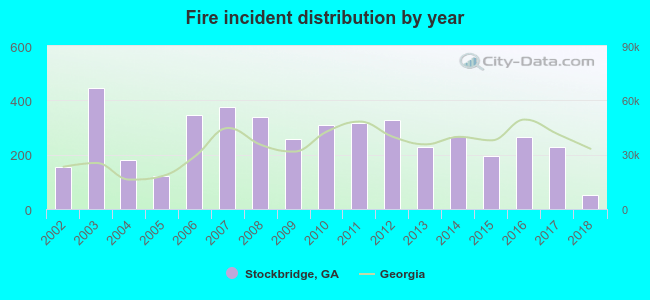 According to the data from the years 2002 - 2018 the average number of fire incidents per year is 260. The highest number of reported fire incidents - 447 took place in 2003, and the least - 50 in 2018. The data has a dropping trend.
The average number of yearly fire incidents per 10k residents in Stockbridge, GA compared to nearest cities:
(Note: Based on data for the last 3 years, including only cities with population 5,000 and above)
| Stockbridge: | 65.5 |
| Morrow: | 142.3 |
| McDonough: | 109.3 |
| Conley: | 53.0 |
| Forest Park: | 76.9 |
| Riverdale: | 147.4 |
| Hampton: | 159.3 |
| Gresham Park: | 5.4 |
| Hapeville: | 43.0 |
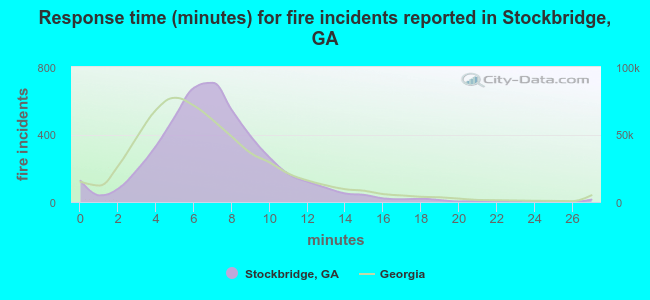 The median response time based on all reported fire incidents is 7 minutes. This is about the same as the Georgia median value.
The median response time in Stockbridge, GA compared to nearest cities:
(Note: Based on data for all years, including only cities with at least 500 fire incidents)
| Stockbridge: | 7 minutes |
| Morrow: | 5 minutes |
| Jonesboro: | 6 minutes |
| McDonough: | 7 minutes |
| Forest Park: | 6 minutes |
| Riverdale: | 5 minutes |
| Hampton: | 8 minutes |
| Hapeville: | 3 minutes |
| Lithonia: | 7 minutes |
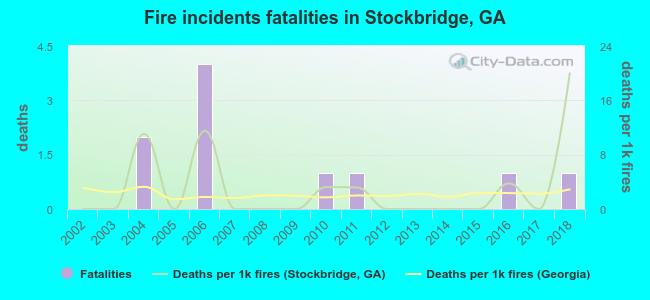 According to the reports from the years 2002 - 2018 the average number of fire-related fatalities per year is 1. The highest number of reported deaths - 4 took place in 2006, and the lowest - 0 in 2002. The data has a growing trend.
The average number of deaths per 1,000 fires is 3. This indicator was the highest - 20 in 2018, and the lowest 0 in 2002. The trend for deaths per 1,000 fires is increasing. Compared to the state value the number of fatalities per 1,000 fire incidents is similar.
According to the reports from the years 2002 - 2018 the average number of fire-related fatalities per year is 1. The highest number of reported deaths - 4 took place in 2006, and the lowest - 0 in 2002. The data has a growing trend.
The average number of deaths per 1,000 fires is 3. This indicator was the highest - 20 in 2018, and the lowest 0 in 2002. The trend for deaths per 1,000 fires is increasing. Compared to the state value the number of fatalities per 1,000 fire incidents is similar.Deaths per 1,000 incidents in Stockbridge, GA compared to nearest cities:
(Note: Based on data for all years, including only cities with at least 2,500 fire incidents)
| Stockbridge: | 2.3 |
| Jonesboro: | 1.1 |
| McDonough: | 0.7 |
| Riverdale: | 1.0 |
| Lithonia: | 1.6 |
| Fayetteville: | 1.7 |
| College Park: | 1.9 |
| Conyers: | 3.2 |
| Decatur: | 2.1 |
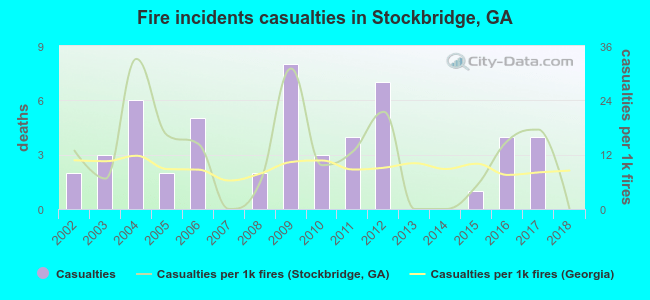 Based on the data from the years 2002 - 2018 the average number of fire-related yearly casualties is 3. The highest number of injuries - 8 took place in 2009, and the lowest - 0 in 2007. The data has a dropping trend.
The average number of injuries per 1,000 fires is 12. This indicator was the highest - 33 in 2004, and the lowest 0 in 2007. The trend for casualties per 1,000 fires is declining. Compared to the Georgia value the number of casualties per 1,000 fires is higher.
Based on the data from the years 2002 - 2018 the average number of fire-related yearly casualties is 3. The highest number of injuries - 8 took place in 2009, and the lowest - 0 in 2007. The data has a dropping trend.
The average number of injuries per 1,000 fires is 12. This indicator was the highest - 33 in 2004, and the lowest 0 in 2007. The trend for casualties per 1,000 fires is declining. Compared to the Georgia value the number of casualties per 1,000 fires is higher.
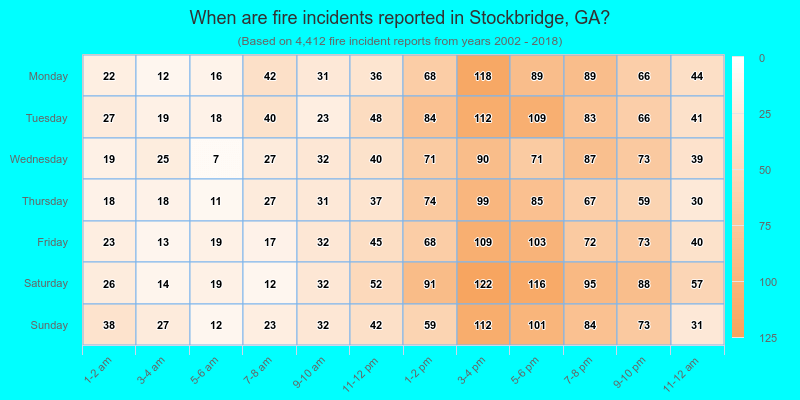
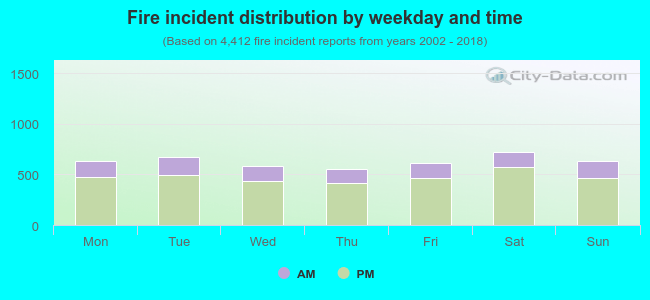 25.0% incidents where reported in the morning and 75.0% in the evening. The most fires (16.4%) took place on Saturday, and the least (12.6%) on Thursday.
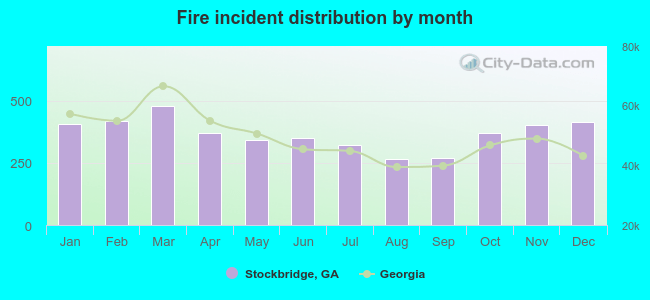 According to the 4,412 incident reports from years 2002 - 2018 most fires (10.9%) took place during March, and the least (6.0%) in August.
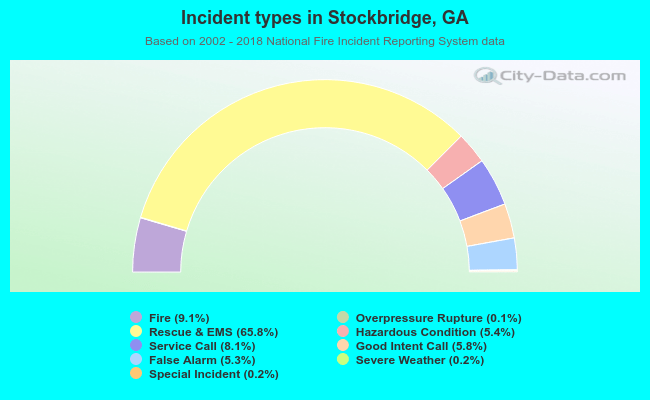 Out of all 48,435 cases reported during the years 2002 - 2018, the most belonged to the categories: Rescue & EMS (65.8%), Fire (9.1%), and Service Call (8.1%).
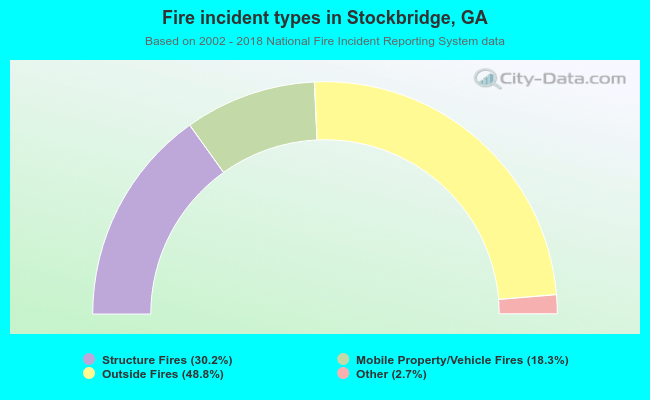 When looking into fire subcategories, the most incidents belonged to: Outside Fires (48.8%), and Structure Fires (30.2%).