Clayton: Fire Incidents, Ohio (OH)
Where are fire incidents reported in Clayton, OH
Something went wrong! Please refresh the page.
|
| |||||||||||||||||||||||||||||||||||||||||||||||||||||||||||||||||||||||||||||||||||||||||||||||||||||||||||||
2002 - 2018 National Fire Incident Reporting System (NFIRS) incidents
- Incident types reported to NFIRS in Clayton, OH
- 1,53250.9%Rescue & EMS
- 40813.5%Hazardous Condition
- 36512.1%Fire
- 2929.7%Good Intent Call
- 2347.8%False Alarm
- 1725.7%Service Call
- 60.2%Severe Weather
- Fire incident types reported to NFIRS in Clayton, OH
- 25569.9%Structure Fires
- 5815.9%Outside Fires
- 4913.4%Mobile Property/Vehicle Fires
- 30.8%Other
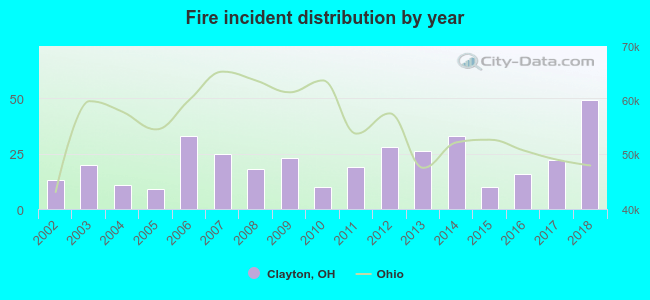 Based on the data from the years 2002 - 2018 the average number of fire incidents per year is 21. The highest number of fires - 49 took place in 2018, and the least - 9 in 2005. The data has an increasing trend.
The average number of yearly fire incidents per 10k residents in Clayton, OH compared to nearest cities:
(Note: Based on data for the last 3 years, including only cities with population 5,000 and above)
| Clayton: | 22.0 |
| Englewood: | 42.9 |
| Union: | 18.8 |
| Trotwood: | 55.3 |
| Shiloh: | 12.6 |
| Brookville: | 101.8 |
| Vandalia: | 55.9 |
| Dayton: | 44.3 |
| Huber Heights: | 30.3 |

 Based on the data from the years 2002 - 2018 the average number of fire-related casualties per year is 0. The highest number of casualties - 4 took place in 2018, and the lowest - 0 in 2002. The data has a growing trend.
 27.4% incidents where reported in the morning and 72.6% in the evening. The most fires (17.8%) took place on Sunday, and the least (12.1%) on Monday.
 Based on the 365 reports from years 2002 - 2018 most fires (12.3%) took place during February, and the least (5.8%) in August.
 Out of all 3,012 cases reported during the years 2002 - 2018, the most belonged to the categories: Rescue & EMS (50.9%), Hazardous Condition (13.5%), and Fire (12.1%).
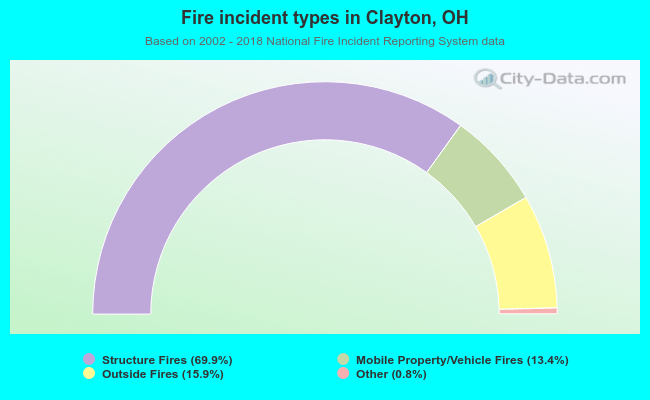 When looking into fire subcategories, the most incidents belonged to: Structure Fires (69.9%), and Outside Fires (15.9%).