Catoosa: Fire Incidents, Oklahoma (OK)
Where are fire incidents reported in Catoosa, OK
Something went wrong! Please refresh the page.
|
| |||||||||||||||||||||||||||||||||||||||||||||||||||||||||||||||||||||||||||||||||||||||||||||||||||||||||||||
2002 - 2018 National Fire Incident Reporting System (NFIRS) incidents
- Incident types reported to NFIRS in Catoosa, OK
- 4,13946.6%Rescue & EMS
- 1,71619.3%Fire
- 1,37415.5%Good Intent Call
- 7999.0%Hazardous Condition
- 4775.4%Service Call
- 3163.6%False Alarm
- 380.4%Special Incident
- 90.1%Severe Weather
- Fire incident types reported to NFIRS in Catoosa, OK
- 85950.1%Outside Fires
- 40623.7%Structure Fires
- 34019.8%Mobile Property/Vehicle Fires
- 1116.5%Other
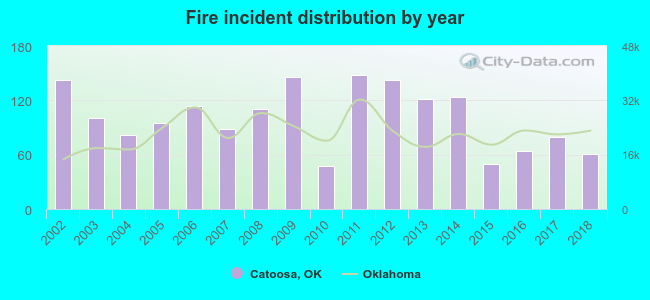 According to the data from the years 2002 - 2018 the average number of fire incidents per year is 101. The highest number of reported fire incidents - 148 took place in 2011, and the least - 48 in 2010. The data has a dropping trend.
The average number of yearly fire incidents per 10k residents in Catoosa, OK compared to nearest cities:
(Note: Based on data for the last 3 years, including only cities with population 5,000 and above)
| Catoosa: | 95.6 |
| Owasso: | 34.9 |
| Broken Arrow: | 20.0 |
| Tulsa: | 50.9 |
| Claremore: | 109.6 |
| Collinsville: | 102.6 |
| Coweta: | 31.5 |
| Bixby: | 20.1 |
| Jenks: | 35.9 |
 The median response time based on all reported fire incidents is 7 minutes. This is similar to the Oklahoma median value.
The median response time in Catoosa, OK compared to nearest cities:
(Note: Based on data for all years, including only cities with at least 500 fire incidents)
| Catoosa: | 7 minutes |
| Owasso: | 5 minutes |
| Broken Arrow: | 6 minutes |
| Tulsa: | 4 minutes |
| Claremore: | 6 minutes |
| Collinsville: | 7 minutes |
| Inola: | 9 minutes |
| Sperry: | 6 minutes |
| Coweta: | 6 minutes |
 Based on the reports from the years 2002 - 2018 the average number of fire-related yearly deaths is 0. The highest number of deaths - 1 took place in 2008, and the lowest - 0 in 2002. The data has a constant trend.
 28.8% incidents where reported in the morning and 71.2% in the evening. The most fires (16.6%) took place on Tuesday, and the least (12.8%) on Sunday.
 Based on the 1,716 incident reports from years 2002 - 2018 most fires (12.6%) took place during March, and the least (5.2%) in October.
 Out of all 8,873 cases reported during the years 2002 - 2018, the most belonged to the categories: Rescue & EMS (46.6%), Fire (19.3%), and Good Intent Call (15.5%).
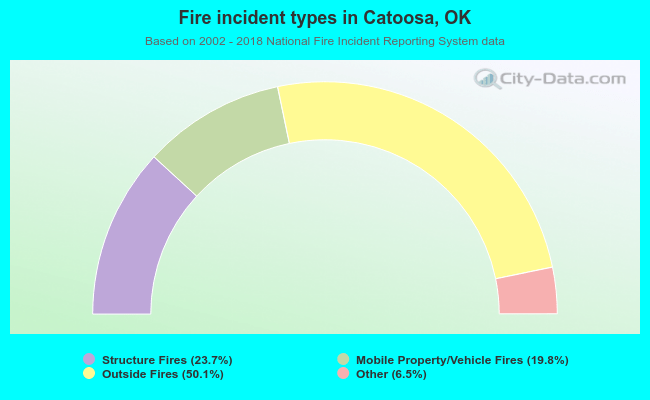 When looking into fire subcategories, the most reports belonged to: Outside Fires (50.1%), and Structure Fires (23.7%).