Bixby: Fire Incidents, Oklahoma (OK)
Where are fire incidents reported in Bixby, OK
Something went wrong! Please refresh the page.
| Fire incidents reported | |
|---|---|
| Sreet name | Count |
| MEMORIAL DR | 234 |
| MINGO RD | 90 |
| SHERIDAN RD | 70 |
| YALE AVE | 52 |
| 191ST ST | 44 |
| 161ST ST | 42 |
| GARNETT RD | 42 |
| 151ST ST | 40 |
| HARVARD ST | 38 |
| 131ST ST | 36 |
| 181ST ST | 32 |
| US 64 HWY | 32 |
| 171ST ST | 30 |
| 129TH AVE | 28 |
| 145TH AVE | 28 |
| 161ST AVE | 28 |
| YALE PL | 26 |
| 121ST ST | 22 |
| 91ST AVE | 20 |
| RIVERVIEW | 20 |
| EAGLE DR | 18 |
| LEWIS AVE | 18 |
| 111TH ST | 16 |
| 141ST ST | 16 |
| 86TH AVE | 16 |
| MAIN CT | 16 |
| 134TH ST | 14 |
| 201ST ST | 14 |
| CHAMP JOHNSON RD | 14 |
| GRANT ST | 14 |
2002 - 2018 National Fire Incident Reporting System (NFIRS) incidents
- Incident types reported to NFIRS in Bixby, OK
- 4,49454.2%Rescue & EMS
- 99212.0%Fire
- 7729.3%Service Call
- 7719.3%Hazardous Condition
- 6127.4%False Alarm
- 5316.4%Good Intent Call
- 931.1%Special Incident
- 260.3%Overpressure Rupture
- Fire incident types reported to NFIRS in Bixby, OK
- 60260.7%Outside Fires
- 20320.5%Structure Fires
- 13813.9%Mobile Property/Vehicle Fires
- 494.9%Other
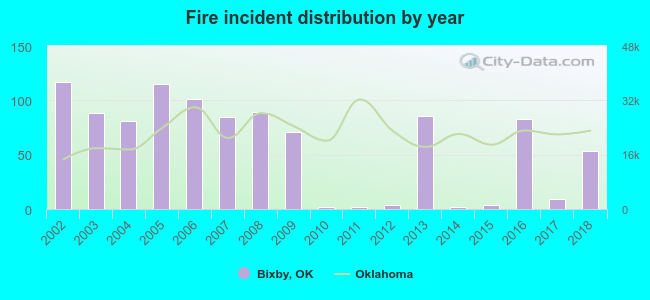 According to the data from the years 2002 - 2018 the average number of fires per year is 58. The highest number of reported fires - 117 took place in 2002, and the least - 2 in 2010. The data has a declining trend.
The average number of yearly fire incidents per 10k residents in Bixby, OK compared to nearest cities:
(Note: Based on data for the last 3 years, including only cities with population 5,000 and above)
| Bixby: | 20.1 |
| Jenks: | 35.9 |
| Glenpool: | 49.5 |
| Broken Arrow: | 20.0 |
| Coweta: | 31.5 |
| Tulsa: | 50.9 |
| Sapulpa: | 90.7 |
| Catoosa: | 95.6 |
| Sand Springs: | 130.8 |
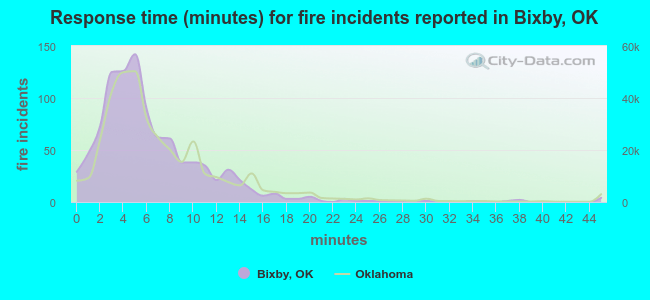 The median response time based on all reported fire incidents is 5 minutes. This is lower than the Oklahoma median value.
The median response time in Bixby, OK compared to nearest cities:
(Note: Based on data for all years, including only cities with at least 500 fire incidents)
| Bixby: | 5 minutes |
| Jenks: | 5 minutes |
| Glenpool: | 4 minutes |
| Broken Arrow: | 6 minutes |
| Coweta: | 6 minutes |
| Tulsa: | 4 minutes |
| Sapulpa: | 5 minutes |
| Catoosa: | 7 minutes |
| Beggs: | 10 minutes |
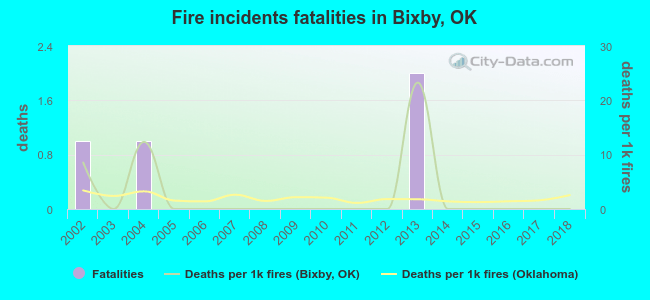 According to the reports from the years 2002 - 2018 the average number of fire-related yearly deaths is 0. The highest number of reported deaths - 2 took place in 2013, and the lowest - 0 in 2003. The data has a declining trend.
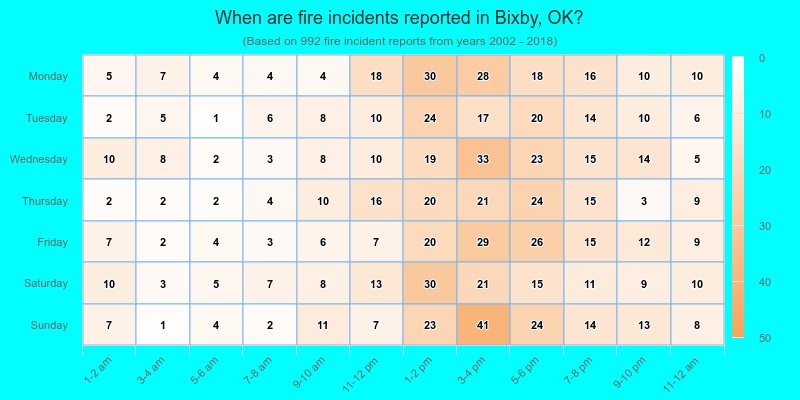
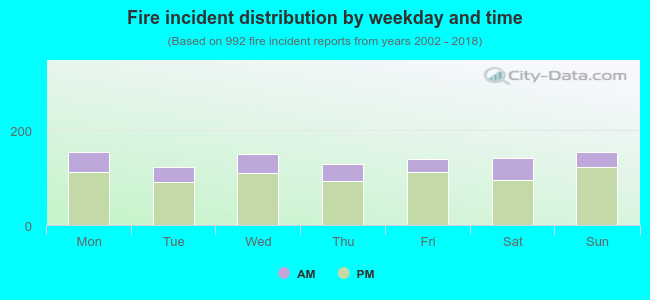 26.0% incidents where reported in the morning and 74.0% in the evening. The most fires (15.6%) took place on Sunday, and the least (12.4%) on Tuesday.
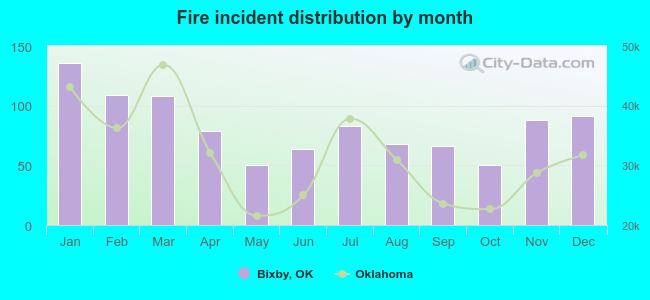 According to the 992 incident reports from years 2002 - 2018 most fires (13.7%) took place during January, and the least (5.0%) in May.
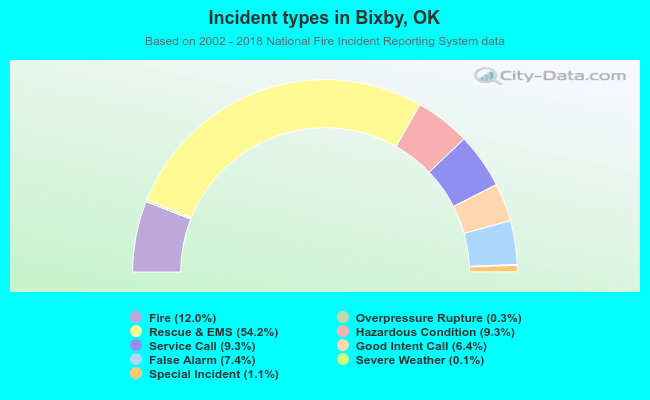 Out of all 8,299 cases reported during the years 2002 - 2018, the most belonged to the categories: Rescue & EMS (54.2%), Fire (12.0%), and Service Call (9.3%).
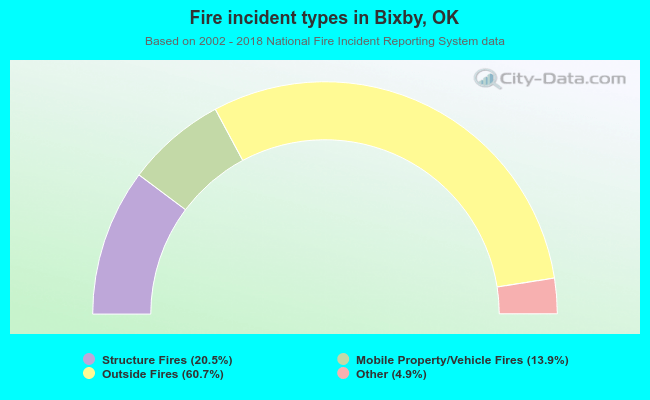 When looking into fire subcategories, the most reports belonged to: Outside Fires (60.7%), and Structure Fires (20.5%).