Bryant: Fire Incidents, Arkansas (AR)
Where are fire incidents reported in Bryant, AR
Something went wrong! Please refresh the page.
| Fire incidents reported | |
|---|---|
| Sreet name | Count |
| I-30 | 96 |
| HWY 5 | 62 |
| REYNOLDS RD | 58 |
| REYNOLDS ROAD | 50 |
| SPRINGHILL ROAD | 38 |
| I30 | 34 |
| REYNOLDS | 32 |
| SHOBE RD | 32 |
| SPRINGHILL RD | 30 |
| 5 HWY | 28 |
| MILLS PARK ROAD | 28 |
| I 30 | 24 |
| MILLS PARK RD | 24 |
| BOONE RD | 22 |
| HWY 5 N | 20 |
| SHOBE ROAD | 20 |
| 3RD ST | 16 |
| 4TH ST | 16 |
| BIVENS LOOP | 16 |
| ALCOA RD | 14 |
| BIVENS LOOP | 14 |
| BRYANT AVE | 14 |
| FOURTH STREET | 14 |
| FOX RIDGE DR | 14 |
| HILL FARM ROAD | 14 |
| INTERSTATE 30 | 14 |
| PRICKETT RD | 14 |
| REYNOLDS RD | 14 |
| WHISPERING OAK | 14 |
| ALCOA ROAD | 12 |
| Other | 893 |
2002 - 2018 National Fire Incident Reporting System (NFIRS) incidents
- Incident types reported to NFIRS in Bryant, AR
- 7,64352.8%Rescue & EMS
- 1,76512.2%Special Incident
- 1,69111.7%Fire
- 1,1367.8%Good Intent Call
- 8996.2%Service Call
- 7865.4%Hazardous Condition
- 5173.6%False Alarm
- 240.2%Severe Weather
- Fire incident types reported to NFIRS in Bryant, AR
- 82949.0%Outside Fires
- 54732.3%Structure Fires
- 20812.3%Mobile Property/Vehicle Fires
- 1076.3%Other
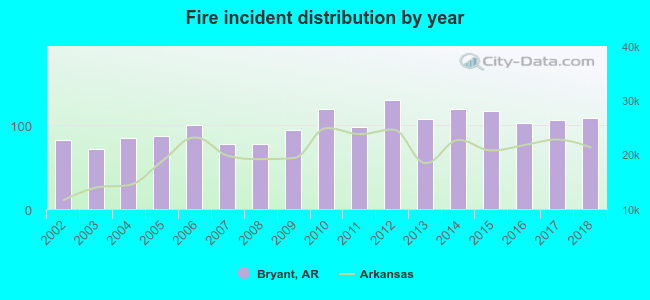 Based on the data from the years 2002 - 2018 the average number of fire incidents per year is 99. The highest number of fires - 130 took place in 2012, and the least - 72 in 2003. The data has a growing trend.
The average number of yearly fire incidents per 10k residents in Bryant, AR compared to nearest cities:
(Note: Based on data for the last 3 years, including only cities with population 5,000 and above)
| Bryant: | 54.2 |
| Benton: | 96.6 |
| East End: | 1.4 |
| Little Rock: | 80.1 |
| Maumelle: | 23.6 |
| North Little Rock: | 87.9 |
| Sherwood: | 68.3 |
| Malvern: | 210.6 |
| Jacksonville: | 71.7 |
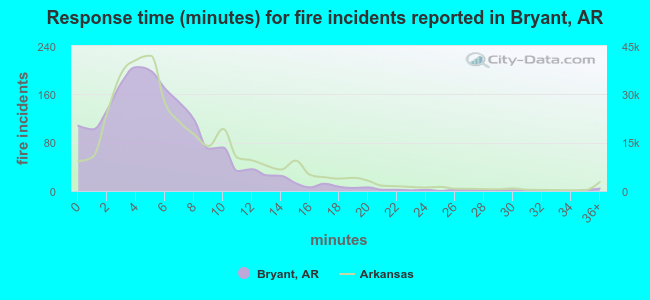 The median response time based on all reported fire incidents is 5 minutes. This is lower compared to the Arkansas median value.
The median response time in Bryant, AR compared to nearest cities:
(Note: Based on data for all years, including only cities with at least 500 fire incidents)
| Bryant: | 5 minutes |
| Alexander: | 9 minutes |
| Bauxite: | 10 minutes |
| Benton: | 6 minutes |
| Little Rock: | 5 minutes |
| Maumelle: | 3 minutes |
| North Little Rock: | 5 minutes |
| Hensley: | 10 minutes |
| Sheridan: | 10 minutes |
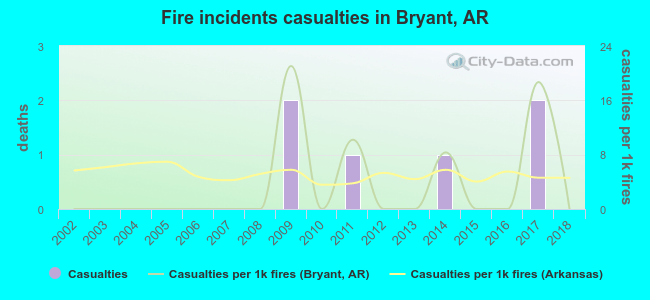 According to the reports from the years 2002 - 2018 the average number of fire-related yearly casualties is 0. The highest number of casualties - 2 took place in 2009, and the lowest - 0 in 2002. The data has a constant trend.
The average number of injuries per 1,000 fires is 3. This indicator was the highest - 21 in 2009, and the lowest 0 in 2002. The trend for casualties per 1,000 incidents is constant. Compared to the Arkansas value the number of casualties per 1,000 incidents is lower.
According to the reports from the years 2002 - 2018 the average number of fire-related yearly casualties is 0. The highest number of casualties - 2 took place in 2009, and the lowest - 0 in 2002. The data has a constant trend.
The average number of injuries per 1,000 fires is 3. This indicator was the highest - 21 in 2009, and the lowest 0 in 2002. The trend for casualties per 1,000 incidents is constant. Compared to the Arkansas value the number of casualties per 1,000 incidents is lower.Casualties per 1,000 incidents in Bryant, AR compared to nearest cities:
(Note: Based on data for all years, including only cities with at least 500 fire incidents)
| Bryant: | 3.5 |
| Alexander: | 3.5 |
| Bauxite: | 0.0 |
| Benton: | 0.8 |
| Little Rock: | 9.9 |
| Maumelle: | 10.5 |
| North Little Rock: | 4.5 |
| Hensley: | 0.0 |
| Sheridan: | 2.2 |
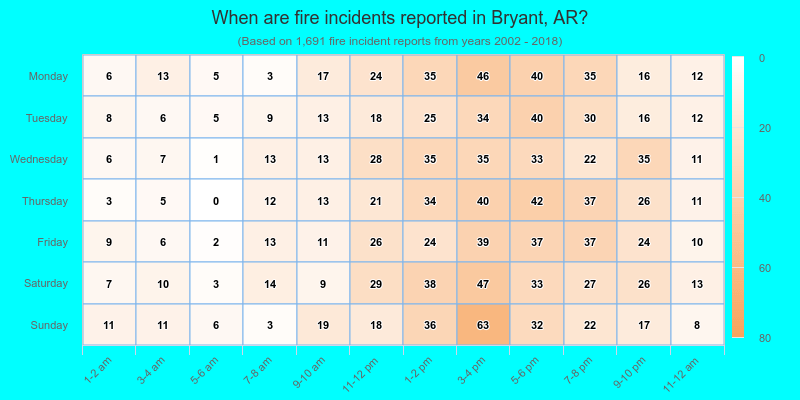
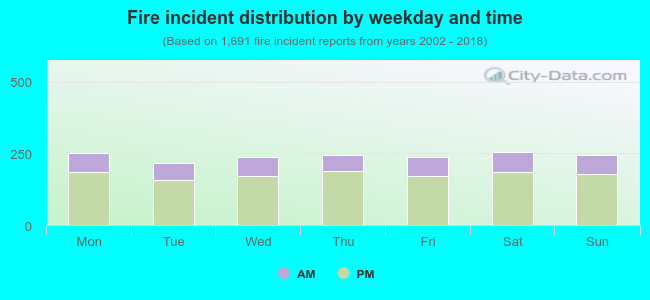 27.0% incidents where reported in the morning and 73.0% in the evening. The most fires (15.1%) took place on Saturday, and the least (12.8%) on Tuesday.
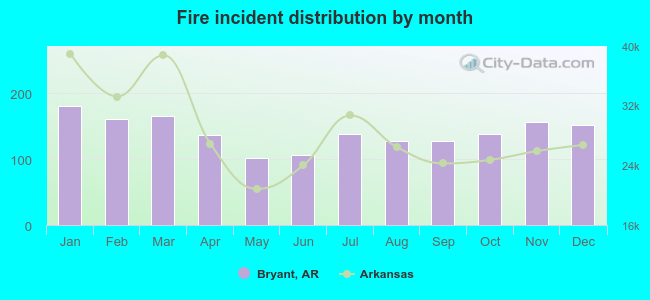 According to the 1,691 incident reports from years 2002 - 2018 most fires (10.7%) took place during January, and the least (6.0%) in May.
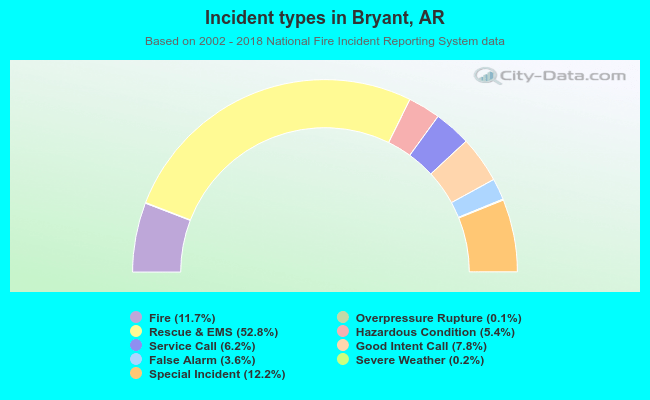 Out of all 14,474 cases reported during the years 2002 - 2018, the most belonged to the categories: Rescue & EMS (52.8%), Special Incident (12.2%), and Fire (11.7%).
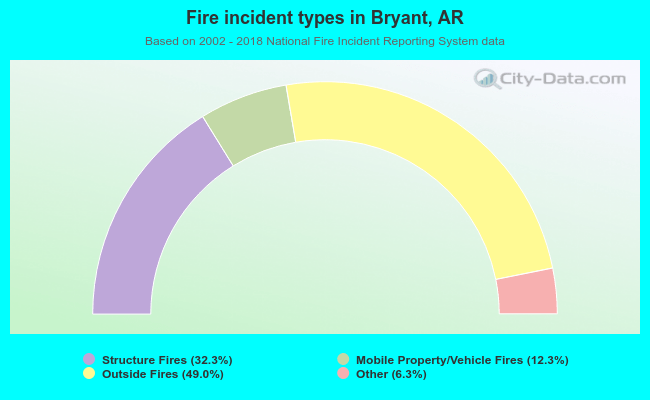 When looking into fire subcategories, the most reports belonged to: Outside Fires (49.0%), and Structure Fires (32.3%).