Boca Raton: Fire Incidents, Florida (FL)
Where are fire incidents reported in Boca Raton, FL
Something went wrong! Please refresh the page.
| Fire incidents reported | |
|---|---|
| Sreet name | Count |
| I95 | 298 |
| I-95 | 294 |
| GLADES RD | 292 |
| 2ND AVE | 194 |
| FEDERAL HWY | 176 |
| FEDERAL HWY | 172 |
| OCEAN BLVD | 160 |
| PALMETTO PARK RD | 158 |
| CAMINO REAL | 156 |
| GLADES | 154 |
| OCEAN BLVD | 136 |
| 13TH ST | 128 |
| MILITARY TRL | 124 |
| 5TH AVE | 112 |
| 4TH AVE | 108 |
| YAMATO RD | 100 |
| DIXIE HWY | 96 |
| 20TH ST | 88 |
| DIXIE HWY | 70 |
| PALMETTO PARK | 62 |
| CLINT MOORE RD | 58 |
| YAMATO | 58 |
| CONGRESS AVE | 56 |
| PLAZA REAL | 56 |
| 15TH ST | 54 |
| STATE ROAD 7 | 52 |
| 8TH ST | 50 |
| 1ST AVE | 46 |
| CLINT MOORE | 42 |
| MILITARY TRL | 42 |
2002 - 2018 National Fire Incident Reporting System (NFIRS) incidents
- Incident types reported to NFIRS in Boca Raton, FL
- 66,54466.7%Rescue & EMS
- 11,98912.0%False Alarm
- 8,8888.9%Service Call
- 5,9375.9%Hazardous Condition
- 3,4513.5%Fire
- 2,8102.8%Good Intent Call
- 1180.1%Overpressure Rupture
- Fire incident types reported to NFIRS in Boca Raton, FL
- 1,48943.1%Outside Fires
- 99328.8%Structure Fires
- 85724.8%Mobile Property/Vehicle Fires
- 1123.2%Other
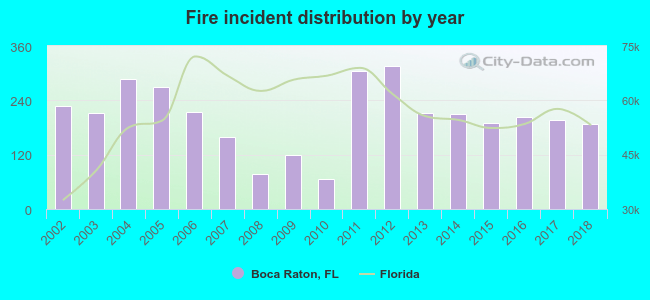 Based on the data from the years 2002 - 2018 the average number of fires per year is 203. The highest number of fire incidents - 315 took place in 2012, and the least - 67 in 2010. The data has a decreasing trend.
The average number of yearly fire incidents per 10k residents in Boca Raton, FL compared to nearest cities:
(Note: Based on data for the last 3 years, including only cities with population 5,000 and above)
| Boca Raton: | 21.4 |
| Deerfield Beach: | 20.3 |
| Delray Beach: | 25.0 |
| Lighthouse Point: | 22.5 |
| Coconut Creek: | 13.4 |
| Pompano Beach: | 20.2 |
| Parkland: | 4.4 |
| Margate: | 17.2 |
| Boynton Beach: | 15.6 |
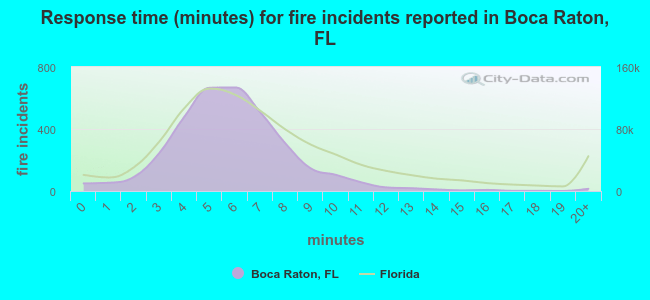 The median response time based on all reported fire incidents is 6 minutes. This is about the same as the state median value.
The median response time in Boca Raton, FL compared to nearest cities:
(Note: Based on data for all years, including only cities with at least 500 fire incidents)
| Boca Raton: | 6 minutes |
| Deerfield Beach: | 6 minutes |
| Delray Beach: | 5 minutes |
| Coconut Creek: | 6 minutes |
| Pompano Beach: | 6 minutes |
| Margate: | 5 minutes |
| Boynton Beach: | 5 minutes |
| Coral Springs: | 5 minutes |
| North Lauderdale: | 5 minutes |
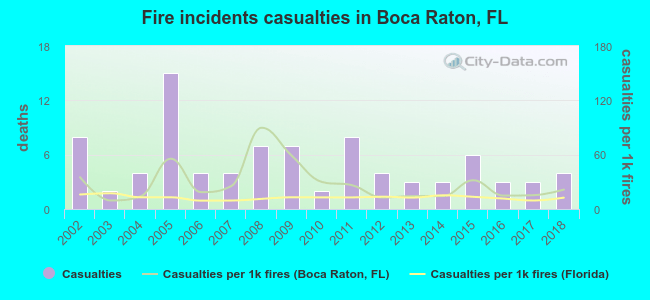 Based on the data from the years 2002 - 2018 the average number of fire-related casualties per year is 5. The highest number of reported casualties - 15 took place in 2005, and the lowest - 2 in 2003. The data has a decreasing trend.
The average number of injuries per 1,000 fires is 29. This indicator was the highest - 90 in 2008, and the lowest 9 in 2003. The trend for injuries per 1,000 fire incidents is decreasing. Compared to the Florida value the number of injuries per 1,000 fires is much higher.
Based on the data from the years 2002 - 2018 the average number of fire-related casualties per year is 5. The highest number of reported casualties - 15 took place in 2005, and the lowest - 2 in 2003. The data has a decreasing trend.
The average number of injuries per 1,000 fires is 29. This indicator was the highest - 90 in 2008, and the lowest 9 in 2003. The trend for injuries per 1,000 fire incidents is decreasing. Compared to the Florida value the number of injuries per 1,000 fires is much higher.Casualties per 1,000 incidents in Boca Raton, FL compared to nearest cities:
(Note: Based on data for all years, including only cities with at least 500 fire incidents)
| Boca Raton: | 25.2 |
| Deerfield Beach: | 21.5 |
| Delray Beach: | 25.3 |
| Coconut Creek: | 23.3 |
| Pompano Beach: | 41.3 |
| Margate: | 25.8 |
| Boynton Beach: | 17.3 |
| Coral Springs: | 16.9 |
| North Lauderdale: | 7.7 |
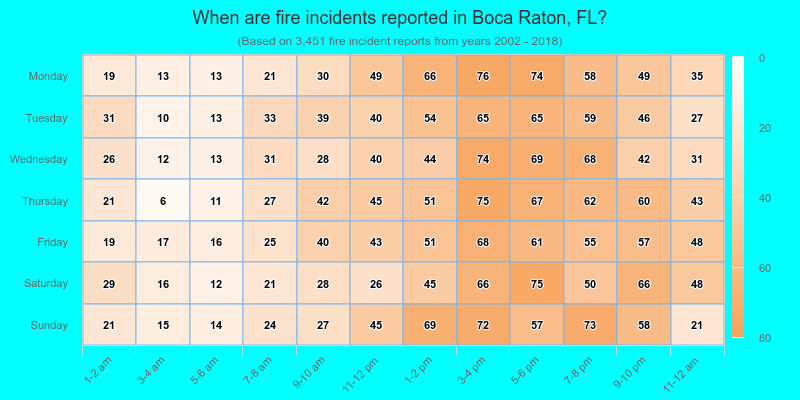
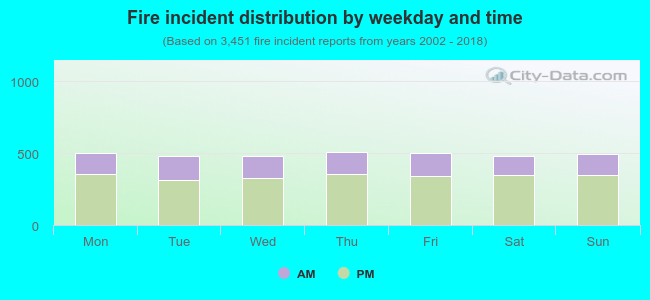 30.5% incidents where reported in the morning and 69.5% in the evening. The most fires (14.8%) took place on Thursday, and the least (13.9%) on Wednesday.
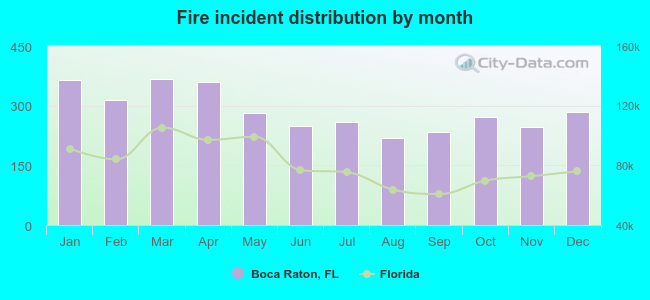 Based on the 3,451 fire incident reports from years 2002 - 2018 most fires (10.6%) took place during March, and the least (6.3%) in August.
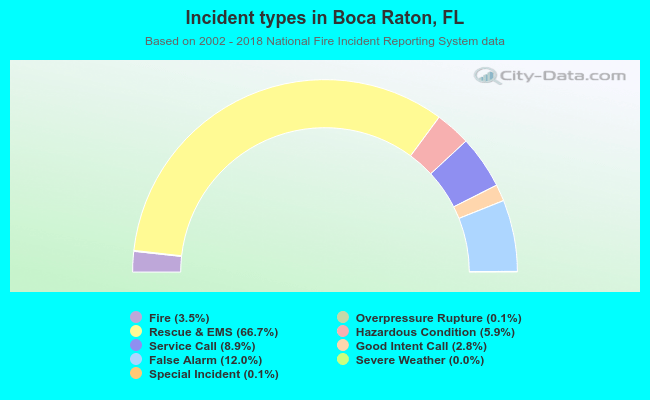 Out of all 99,811 cases reported during the years 2002 - 2018, the most belonged to the categories: Rescue & EMS (66.7%), False Alarm (12.0%), and Service Call (8.9%).
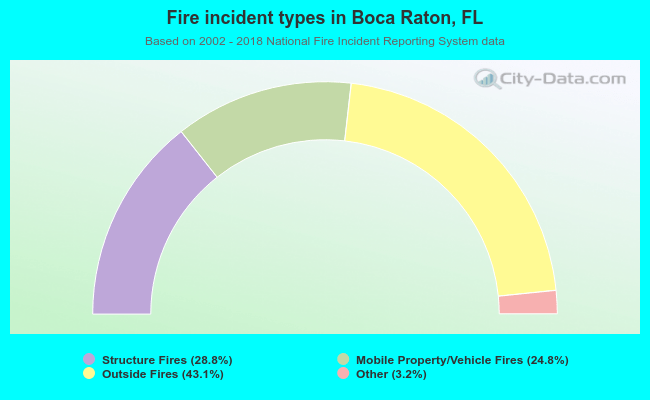 When looking into fire subcategories, the most incidents belonged to: Outside Fires (43.1%), and Structure Fires (28.8%).