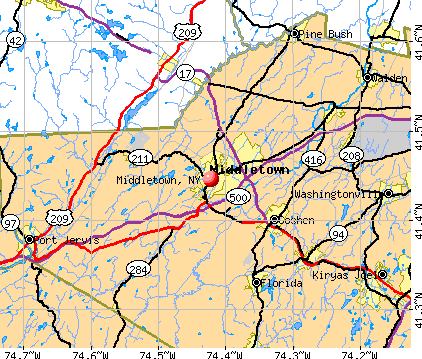
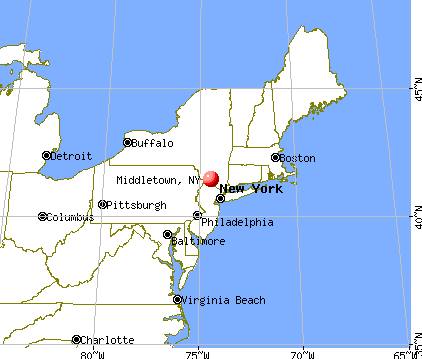
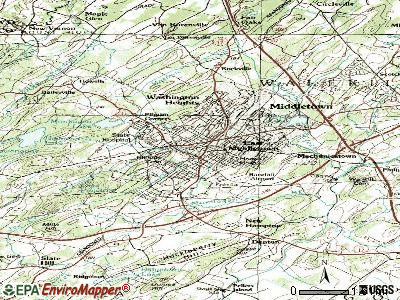
Middletown, New York

Middletown: Main Street

Middletown: Mid-November at Brittany Drive

Middletown: the corner of Hillcrest and Sproat st in Middletown, NY taken in the Winter
- add
your
Submit your own pictures of this city and show them to the world
- OSM Map
- General Map
- Google Map
- MSN Map
Population change since 2000: +19.0%
 |
| Males: 15,366 | |
| Females: 14,841 |
| Median resident age: | 37.1 years |
| New York median age: | 40.0 years |
Zip codes: 10940.
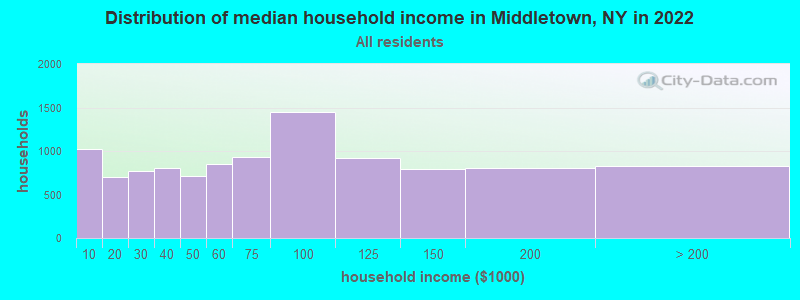
| Middletown: | $68,039 |
| NY: | $79,557 |
Estimated per capita income in 2022: $30,780 (it was $18,947 in 2000)
Middletown city income, earnings, and wages data
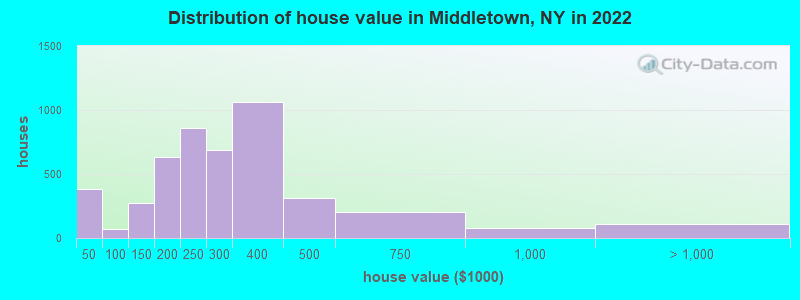
Estimated median house or condo value in 2022: $260,604 (it was $103,200 in 2000)
| Middletown: | $260,604 |
| NY: | $400,400 |
Mean prices in 2022: all housing units: $297,086; detached houses: $283,150; townhouses or other attached units: $295,256; in 2-unit structures: $601,652; in 3-to-4-unit structures: $284,031; in 5-or-more-unit structures: $215,647
Median gross rent in 2022: $1,576.
(9.8% for White Non-Hispanic residents, 10.6% for Black residents, 21.8% for Hispanic or Latino residents, 41.7% for American Indian residents, 71.7% for Native Hawaiian and other Pacific Islander residents, 23.9% for other race residents, 15.3% for two or more races residents)
Detailed information about poverty and poor residents in Middletown, NY


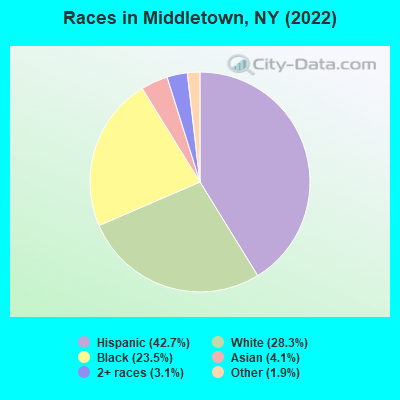
- 13,04442.7%Hispanic
- 8,64328.3%White alone
- 7,16223.5%Black alone
- 1,2494.1%Asian alone
- 9413.1%Two or more races
- 5891.9%Other race alone
Races in Middletown detailed stats: ancestries, foreign born residents, place of birth
According to our research of New York and other state lists, there were 48 registered sex offenders living in Middletown, New York as of May 16, 2024.
The ratio of all residents to sex offenders in Middletown is 580 to 1.
Type |
2009 |
2010 |
2011 |
2012 |
2013 |
2014 |
2015 |
2016 |
2017 |
2018 |
2019 |
2020 |
2021 |
2022 |
|---|---|---|---|---|---|---|---|---|---|---|---|---|---|---|
| Murders (per 100,000) | 1 (3.9) | 1 (3.6) | 2 (7.1) | 2 (7.0) | 1 (3.6) | 1 (3.6) | 0 (0.0) | 1 (3.6) | 2 (7.2) | 0 (0.0) | 3 (10.8) | 1 (3.5) | 0 (0.0) | 2 (6.5) |
| Rapes (per 100,000) | 8 (30.9) | 7 (24.9) | 9 (31.9) | 14 (49.3) | 6 (21.6) | 3 (10.8) | 11 (39.8) | 9 (32.4) | 11 (39.8) | 20 (71.7) | 16 (57.6) | 9 (31.9) | 7 (25.0) | 8 (26.2) |
| Robberies (per 100,000) | 57 (219.9) | 63 (224.3) | 57 (202.0) | 95 (334.6) | 47 (169.0) | 45 (162.5) | 34 (123.0) | 43 (154.9) | 37 (134.0) | 28 (100.4) | 16 (57.6) | 22 (78.0) | 18 (64.3) | 22 (72.0) |
| Assaults (per 100,000) | 89 (343.4) | 79 (281.3) | 95 (336.7) | 117 (412.0) | 60 (215.8) | 76 (274.4) | 68 (246.1) | 96 (345.9) | 53 (192.0) | 62 (222.3) | 52 (187.0) | 58 (205.7) | 60 (214.2) | 77 (252.1) |
| Burglaries (per 100,000) | 204 (787.0) | 194 (690.7) | 167 (591.9) | 206 (725.5) | 136 (489.1) | 162 (584.8) | 121 (437.9) | 105 (378.4) | 75 (271.7) | 71 (254.6) | 45 (161.9) | 52 (184.4) | 30 (107.1) | 42 (137.5) |
| Thefts (per 100,000) | 794 (3,063) | 949 (3,379) | 755 (2,676) | 723 (2,546) | 683 (2,456) | 644 (2,325) | 540 (1,954) | 539 (1,942) | 572 (2,072) | 421 (1,510) | 249 (895.7) | 299 (1,061) | 281 (1,003) | 373 (1,221) |
| Auto thefts (per 100,000) | 26 (100.3) | 28 (99.7) | 25 (88.6) | 19 (66.9) | 33 (118.7) | 22 (79.4) | 22 (79.6) | 21 (75.7) | 11 (39.8) | 18 (64.6) | 14 (50.4) | 32 (113.5) | 16 (57.1) | 23 (75.3) |
| Arson (per 100,000) | 0 (0.0) | 3 (10.7) | 2 (7.1) | 6 (21.1) | 4 (14.4) | 2 (7.2) | 3 (10.9) | 3 (10.8) | 7 (25.4) | 3 (10.8) | 2 (7.2) | 2 (7.1) | 3 (10.7) | 5 (16.4) |
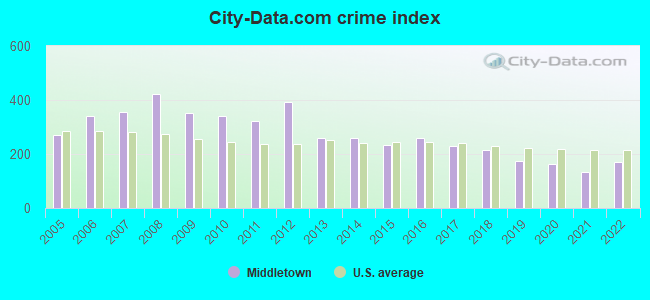
| City-Data.com crime index | 352.7 | 342.1 | 323.2 | 394.3 | 260.3 | 259.8 | 233.2 | 259.0 | 230.1 | 215.3 | 173.5 | 161.6 | 134.3 | 170.6 |
The City-Data.com crime index weighs serious crimes and violent crimes more heavily. Higher means more crime, U.S. average is 246.1. It adjusts for the number of visitors and daily workers commuting into cities.
Crime rate in Middletown detailed stats: murders, rapes, robberies, assaults, burglaries, thefts, arson
Full-time law enforcement employees in 2021, including police officers: 77 (64 officers - 55 male; 9 female).
| Officers per 1,000 residents here: | 2.28 |
| New York average: | 3.28 |
 Recent articles from our blog. Our writers, many of them Ph.D. graduates or candidates, create easy-to-read articles on a wide variety of topics.

 | Middletown/Goshen/Warwick area Home Health Aide Services (0 replies) |
| Why don't we have a Hudson Valley forum? (67 replies) |
| Best place for a family to live if working in Middletown (5 replies) |
| Hispanic/Latino communities in Upstate NY (812 replies) |
| Upstate NY job openings...... (1436 replies) |
| smaller Upstate NY cities and towns/African American communities (5986 replies) |
Latest news from Middletown, NY collected exclusively by city-data.com from local newspapers, TV, and radio stations
Ancestries: American (9.7%), Italian (8.1%), Jamaican (5.3%), Irish (3.5%), Polish (1.7%), German (1.5%).
Current Local Time: EST time zone
Elevation: 540 feet
Land area: 5.14 square miles.
Population density: 5,877 people per square mile (average).
5,432 residents are foreign born (13.7% Latin America, 3.0% Asia).
| This city: | 17.8% |
| New York: | 22.6% |
Median real estate property taxes paid for housing units with mortgages in 2022: $6,725 (2.4%)
Median real estate property taxes paid for housing units with no mortgage in 2022: $4,231 (1.9%)
Nearest city with pop. 50,000+: Ramapo, NY  (28.5 miles , pop. 108,905).
Nearest city with pop. 200,000+: Bronx, NY (50.3 miles , pop. 1,332,650).
Nearest cities:
), ), ), ), ), Latitude: 41.45 N, Longitude: 74.42 W
Daytime population change due to commuting: -1,372 (-4.5%)
Workers who live and work in this city: 3,584 (27.0%)
Area codes: 845, 914

Middletown tourist attractions:
Middletown, New York accommodation & food services, waste management - Economy and Business Data
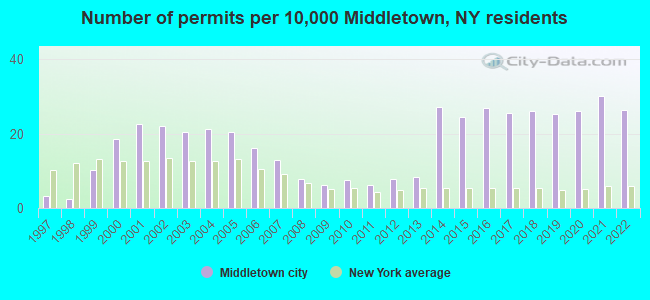
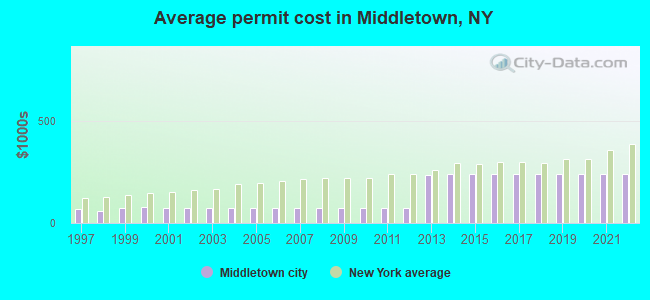
Single-family new house construction building permits:
- 2022: 67 buildings, average cost: $241,400
- 2021: 76 buildings, average cost: $241,400
- 2020: 66 buildings, average cost: $241,400
- 2019: 64 buildings, average cost: $241,400
- 2018: 66 buildings, average cost: $241,400
- 2017: 65 buildings, average cost: $241,400
- 2016: 68 buildings, average cost: $241,400
- 2015: 62 buildings, average cost: $241,400
- 2014: 69 buildings, average cost: $241,400
- 2013: 21 buildings, average cost: $232,300
- 2012: 20 buildings, average cost: $75,400
- 2011: 16 buildings, average cost: $75,400
- 2010: 19 buildings, average cost: $75,400
- 2009: 16 buildings, average cost: $75,400
- 2008: 20 buildings, average cost: $75,400
- 2007: 33 buildings, average cost: $75,400
- 2006: 41 buildings, average cost: $75,400
- 2005: 52 buildings, average cost: $75,400
- 2004: 54 buildings, average cost: $75,400
- 2003: 52 buildings, average cost: $75,400
- 2002: 56 buildings, average cost: $75,400
- 2001: 57 buildings, average cost: $75,400
- 2000: 47 buildings, average cost: $75,900
- 1999: 26 buildings, average cost: $75,000
- 1998: 6 buildings, average cost: $60,800
- 1997: 8 buildings, average cost: $70,000
| Here: | 4.4% |
| New York: | 4.4% |
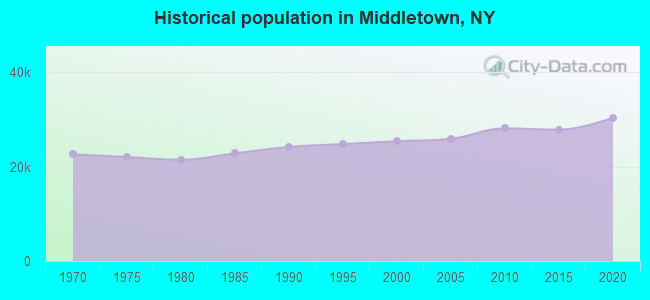
Population change in the 1990s: +768 (+3.1%).
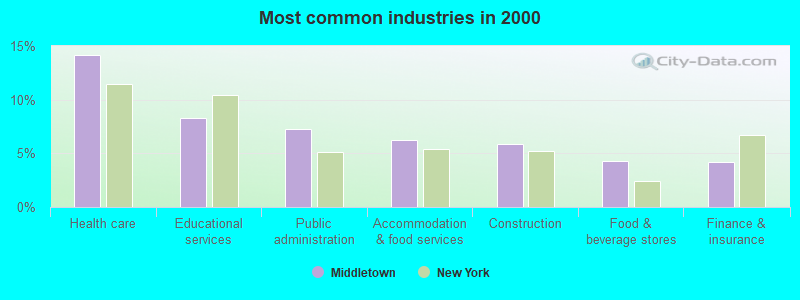
- Health care (14.2%)
- Educational services (8.3%)
- Public administration (7.3%)
- Accommodation & food services (6.2%)
- Construction (5.9%)
- Food & beverage stores (4.3%)
- Finance & insurance (4.2%)
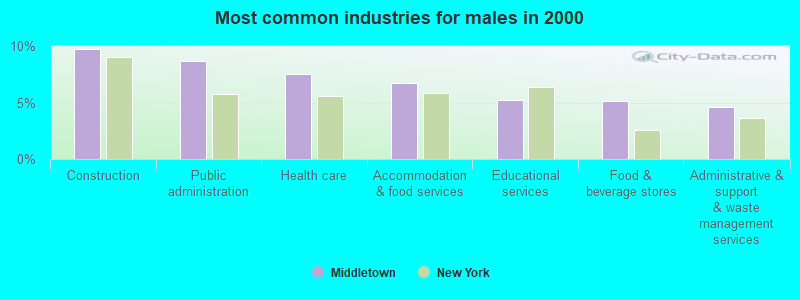
- Construction (9.7%)
- Public administration (8.6%)
- Health care (7.6%)
- Accommodation & food services (6.7%)
- Educational services (5.2%)
- Food & beverage stores (5.1%)
- Administrative & support & waste management services (4.6%)
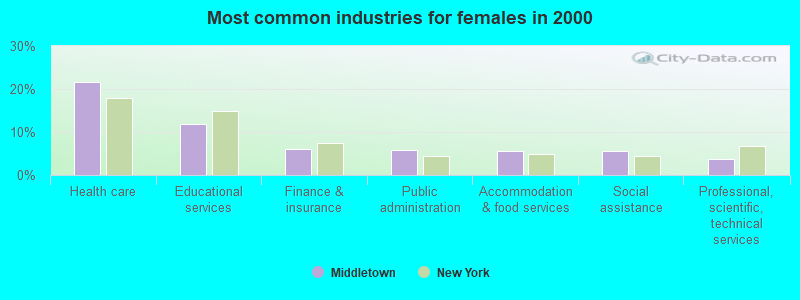
- Health care (21.6%)
- Educational services (11.8%)
- Finance & insurance (6.0%)
- Public administration (5.7%)
- Accommodation & food services (5.7%)
- Social assistance (5.5%)
- Professional, scientific, technical services (3.7%)
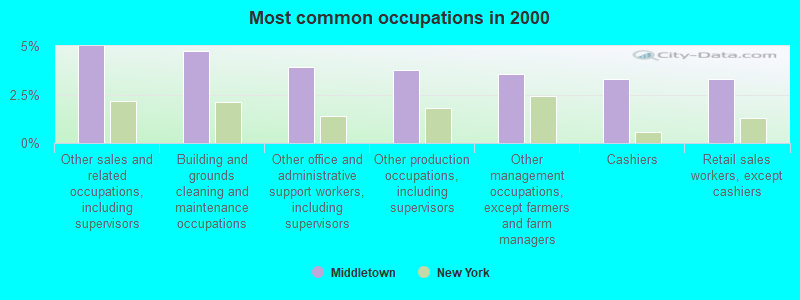
- Other sales and related occupations, including supervisors (5.0%)
- Building and grounds cleaning and maintenance occupations (4.7%)
- Other office and administrative support workers, including supervisors (3.9%)
- Other production occupations, including supervisors (3.8%)
- Other management occupations, except farmers and farm managers (3.5%)
- Cashiers (3.3%)
- Retail sales workers, except cashiers (3.3%)
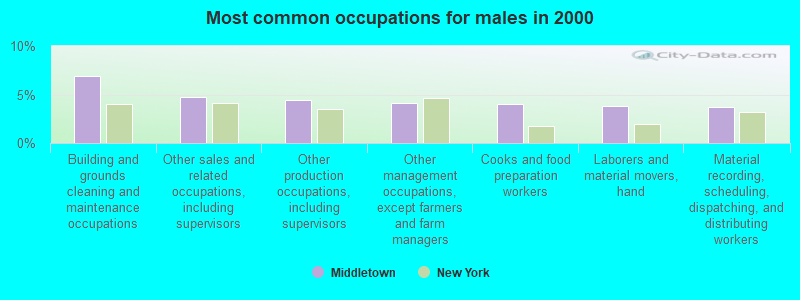
- Building and grounds cleaning and maintenance occupations (6.9%)
- Other sales and related occupations, including supervisors (4.7%)
- Other production occupations, including supervisors (4.5%)
- Other management occupations, except farmers and farm managers (4.1%)
- Cooks and food preparation workers (4.0%)
- Laborers and material movers, hand (3.8%)
- Material recording, scheduling, dispatching, and distributing workers (3.7%)
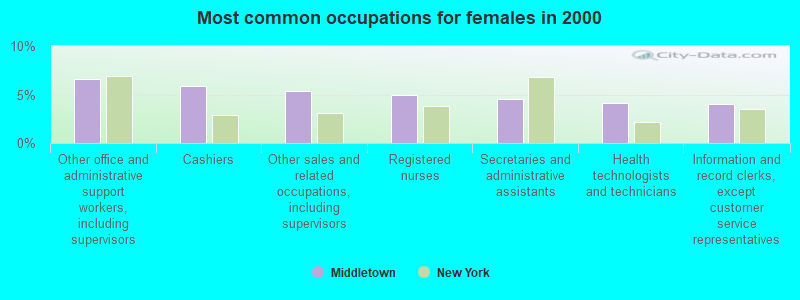
- Other office and administrative support workers, including supervisors (6.6%)
- Cashiers (5.9%)
- Other sales and related occupations, including supervisors (5.3%)
- Registered nurses (5.0%)
- Secretaries and administrative assistants (4.5%)
- Health technologists and technicians (4.1%)
- Information and record clerks, except customer service representatives (4.0%)
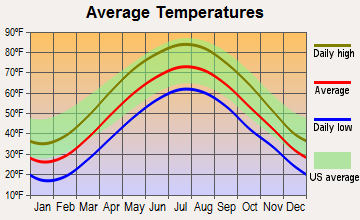
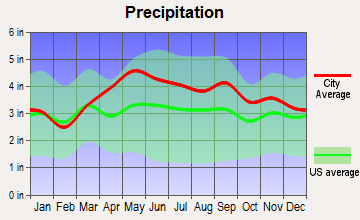
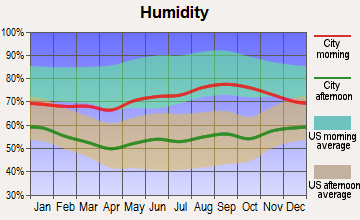
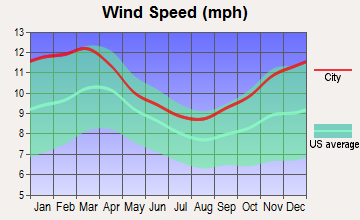
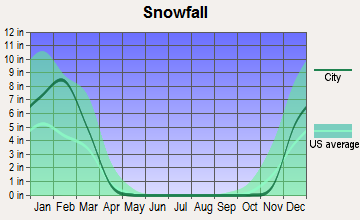
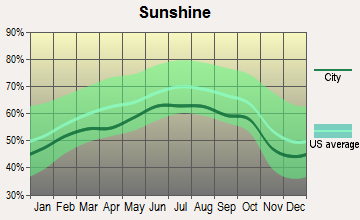
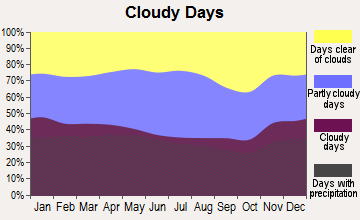
Average climate in Middletown, New York
Based on data reported by over 4,000 weather stations
|
|

(lower is better)
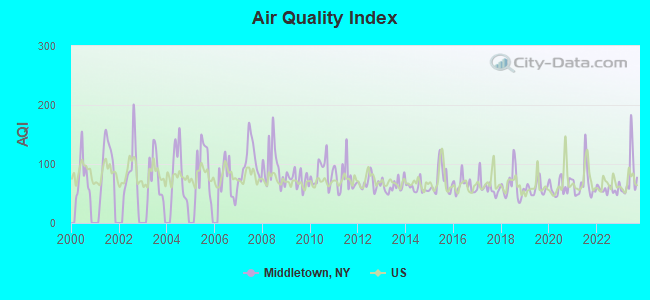
Air Quality Index (AQI) level in 2023 was 78.9. This is about average.
| City: | 78.9 |
| U.S.: | 72.6 |
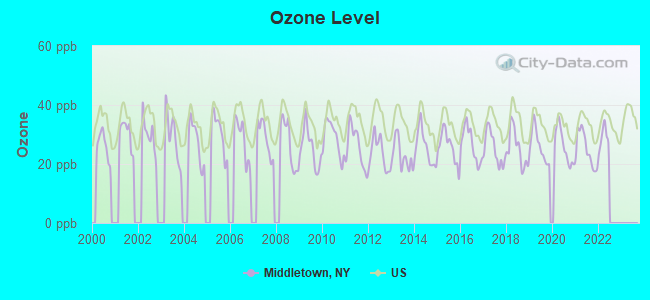
Ozone [ppb] level in 2021 was 24.9. This is better than average. Closest monitor was 12.0 miles away from the city center.
| City: | 24.9 |
| U.S.: | 33.3 |
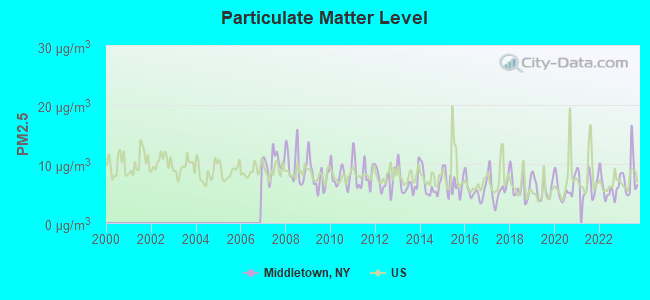
Particulate Matter (PM2.5) [µg/m3] level in 2023 was 7.85. This is about average. Closest monitor was 21.7 miles away from the city center.
| City: | 7.85 |
| U.S.: | 8.11 |
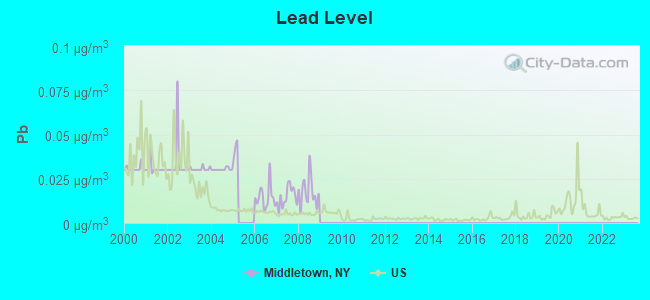
Lead (Pb) [µg/m3] level in 2008 was 0.0176. This is significantly worse than average. Closest monitor was 3.1 miles away from the city center.
| City: | 0.0176 |
| U.S.: | 0.0093 |
Tornado activity:
Middletown-area historical tornado activity is above New York state average. It is 37% smaller than the overall U.S. average.
On 7/14/1988, a category F3 (max. wind speeds 158-206 mph) tornado 8.4 miles away from the Middletown city center injured one person and caused between $500,000 and $5,000,000 in damages.
On 5/31/1998, a category F3 tornado 27.6 miles away from the city center injured 2 people and caused $1 million in damages.
Earthquake activity:
Middletown-area historical earthquake activity is significantly above New York state average. It is 67% smaller than the overall U.S. average.On 10/7/1983 at 10:18:46, a magnitude 5.3 (5.1 MB, 5.3 LG, 5.1 ML, Class: Moderate, Intensity: VI - VII) earthquake occurred 173.5 miles away from Middletown center
On 8/23/2011 at 17:51:04, a magnitude 5.8 (5.8 MW, Depth: 3.7 mi) earthquake occurred 307.9 miles away from the city center
On 4/20/2002 at 10:50:47, a magnitude 5.3 (5.3 ML, Depth: 3.0 mi) earthquake occurred 215.3 miles away from Middletown center
On 4/20/2002 at 10:50:47, a magnitude 5.2 (5.2 MB, 4.2 MS, 5.2 MW, 5.0 MW) earthquake occurred 213.3 miles away from the city center
On 1/16/1994 at 01:49:16, a magnitude 4.6 (4.6 MB, 4.6 LG, Depth: 3.1 mi, Class: Light, Intensity: IV - V) earthquake occurred 114.4 miles away from Middletown center
On 6/17/1991 at 08:53:16, a magnitude 4.1 (4.0 MB, 4.0 LG, Depth: 3.1 mi) earthquake occurred 83.0 miles away from Middletown center
Magnitude types: regional Lg-wave magnitude (LG), body-wave magnitude (MB), local magnitude (ML), surface-wave magnitude (MS), moment magnitude (MW)
Natural disasters:
The number of natural disasters in Orange County (28) is a lot greater than the US average (15).Major Disasters (Presidential) Declared: 18
Emergencies Declared: 9
Causes of natural disasters: Floods: 8, Storms: 8, Hurricanes: 7, Blizzards: 2, Snowstorms: 2, Tropical Storms: 2, Fire: 1, Power Outage: 1, Tropical Depression: 1, Water Shortage: 1, Other: 3 (Note: some incidents may be assigned to more than one category).
Main business address for: MEDIACOM BROADBAND LLC (CABLE & OTHER PAY TELEVISION SERVICES), MEDIACOM COMMUNICATIONS CORP (CABLE & OTHER PAY TELEVISION SERVICES), MEDIACOM CAPITAL CORP (CABLE & OTHER PAY TELEVISION SERVICES), MEDIACOM BROADBAND CORP (CABLE & OTHER PAY TELEVISION SERVICES).
Hospitals and medical centers in Middletown:
- HORTON MEMORIAL HOSPITAL (provides emergency services, 60 PROSPECT AVE)
- MIDDLETOWN PSYCHIATRIC CENTER (141 MONHAGEN AVE)
- ORANGE REGIONAL MEDICAL CENTER (Voluntary non-profit - Private, provides emergency services, 707 EAST MAIN STREET)
- PARK MANOR REHAB AND HEALTH CARE (121 DUNNING ROAD)
- ST TERESA'S NURSING AND REHABILITATION CENTER (120 HIGHLAND AVENUE)
- FMS-MIDDLETOWN DIALYSIS CENTER (220 CRYSTAL RUN ROAD)
Airports and heliports located in Middletown:
- Randall Airport (06N) (Runways: 1, Itinerant Ops: 5,500, Local Ops: 17,000)
- Md1 Airport (08NY) (Runways: 2)
- Lakeside Heliport (70NY)
- Orange Regional Medical Center Heliport (6NY0)
- Phillipsburg Landing Heliport (NY93)
- Slate Hill Heliport (2NY6)
Colleges/Universities in Middletown:
- Orange County Community College (Full-time enrollment: 4,742; Location: 115 South St; Public; Website: www.sunyorange.edu/)
- Beauty School of Middletown (Full-time enrollment: 94; Location: 225 Dolson Ave; Private, for-profit; Website: www.thebeautyschoolofmiddletown.com)
- Orange Ulster BOCES-Practical Nursing Program (Full-time enrollment: 75; Location: 130 Dolson Avenue; Public; Website: www.ouboces.org)
Other colleges/universities with over 2000 students near Middletown:
- Mount Saint Mary College (about 22 miles; Newburgh, NY; Full-time enrollment: 2,166)
- United States Military Academy (about 25 miles; West Point, NY; FT enrollment: 5,651)
- State University of New York at New Paltz (about 27 miles; New Paltz, NY; FT enrollment: 7,319)
- Rockland Community College (about 28 miles; Suffern, NY; FT enrollment: 6,026)
- Sussex County Community College (about 32 miles; Newton, NJ; FT enrollment: 2,402)
- Marist College (about 32 miles; Poughkeepsie, NY; FT enrollment: 5,536)
- Vassar College (about 32 miles; Poughkeepsie, NY; FT enrollment: 2,469)
Public high schools in Middletown:
- MIDDLETOWN HIGH SCHOOL (Students: 2,023, Location: 24 GARDNER AVE EXT, Grades: 9-12)
- MINISINK VALLEY HIGH SCHOOL (Location: 2320 RT 6, Grades: 9-12)
Private high school in Middletown:
- HARMONY CHRISTIAN SCHOOL (Students: 234, Location: 1790 ROUTE 211 E, Grades: PK-12)
Public elementary/middle schools in Middletown:
- MAPLE HILL ELEMENTARY SCHOOL (Students: 1,223, Location: 491 COUNTY RT 78, Grades: KG-5)
- MONHAGEN MIDDLE SCHOOL (Students: 815, Location: 555 COUNTY RT 78, Grades: 6-8)
- MIDDLETOWN TWIN TOWERS MIDDLE SCHOOL (Students: 762, Location: 112 GRAND AVE, Grades: 6-8)
- TRUMAN MOON SCHOOL (Students: 447, Location: 53 BEDFORD AVE, Grades: KG-5)
- WILLIAM A CARTER SCHOOL (Location: 435 E MAIN ST EXT, Grades: KG-5)
- PRESIDENTIAL PARK ELEMENTARY SCHOOL (Location: 50 ROOSEVELT AVE, Grades: KG-5)
- MINISINK VALLEY ELEMENTARY SCHOOL (Location: 2320 RT 6, Grades: KG-2)
- MINISINK VALLEY MIDDLE SCHOOL (Location: 2320 RT 6, Grades: 6-8)
- MINISINK VALLEY INTERMEDIATE SCHOOL (Location: 2320 RT 6, Grades: 3-5)
Private elementary/middle schools in Middletown:
- OUR LADY OF MOUNT CARMEL SCHOOL (Students: 215, Location: 205 WAWAYANDA AVE, Grades: PK-8)
- NEW BEGINNINGS MONTESSORI (Students: 173, Location: 33 ALBERT ST, Grades: PK-2)
- MIDDLETOWN CHRISTIAN SCHOOL-SDA (Students: 41, Location: 70 HIGHLAND AVE, Grades: PK-8)
- ARC ORANGE COUNTY CHAPTER (Students: 25, Location: 28 INGRASSIA RD, Grades: UG-T1)
Library in Middletown:
- THRALL PUBLIC LIBRARY DISTRICT OF MIDDLETOWN AND WALLKILL (Operating income: $2,608,196; Location: 11-19 DEPOT STREET; 181,916 books; 1,923 e-books; 6,277 audio materials; 6,688 video materials; 14 state licensed databases; 27 other licensed databases; 676 print serial subscriptions; 21 electronic serial subscriptions)
User-submitted facts and corrections:
- Middletown, NY was the physical location of the Eatern Army Aircraft Command during the Korean War. The "legal" location was at Stewart Air Force Base in Newburgh, but the Air Force had no room on its base for a rival, the Army, so the Command was physically located in Middletown. The old Orange and Rockland Electric Compny off offices were used as the headquartiers for the Command which coordinated the Anti Airtcraft defense of the NorthEastern US from that bldg. This included New York City, NBew Jersey, Philadelphia,Boston, and Buffalo. Anti Aircraft missle units were stationed in all the major cities during the Korean War. All coordinated from Middletown Unmarried enlisted men were billeted in the Mitchell Inn, an old hotel downtown. They were given meal tickets to pay for meals in local restsurants. Eventually an empty store was converted into a "Mess Hall". Married enlisted men and officers were given monetary allowances to rent rooms and apartments all over town. For medical and dental care personnel had to go to the West Point Hospital, driven in a military vehicle. There was a softball team which played in the Industrial League at the High School. I was stationed in Middletown in 1951.
Points of interest:
Notable locations in Middletown: Middletown Sewage Treatment Plant (A), Erie Railroad Station (B), Horton Dairy (C), Morrison Hall (D), Horton Hall (E), Sarah Wells Building (F), George F Shepard Student Center (G), Harriman Hall (H), Orange Hall (I), Hudson Hall (J), Saint Teresa's Nursing and Rehabilitation Center (K), Middletown Fire Department North Street Station (L), Middletown Fire Department Waalkill Engine Company 6 (M), Middletown Fire Department (N), Fire Department Museum (O), Middletown Recreation Center (P), Thrall Library (Q), Orange County Childrens Home (R), Paramount Theatre (S), Engine House Number 4 (T). Display/hide their locations on the map
Shopping Centers: Playtoggs Shopping Center (1), Campbell Plaza Shopping Center (2), Middletown Commons Shopping Center (3). Display/hide their locations on the map
Churches in Middletown include: United Presbyterian Church of Middletown (Webb Horton Memorial location) (A), United Presbyterian Church of Middletown (First Presbyterian location) (B), Saint John's African Methodist Episcopal Zion Church (C), Saint Joseph's Roman Catholic Church (D), Trinity Presbyterian Church (E), Second Baptist Church (F), First Church of Christ Scientist (G), First Congregational Church of Middletown (H), Christ Church (I). Display/hide their locations on the map
Cemeteries: Saint Joseph Cemetery (1), Hillside Cemetery (2). Display/hide their locations on the map
Parks in Middletown include: Thrall Park (1), Academy Avenue Park (2), Fancher Davidge Park (3), Amchir Park (4), Fancer Davidge Park (5), Summit Field (6), Clemson Park (7), Watts Memorial Park (8). Display/hide their locations on the map
Tourist attractions: Area Schools - Middletown- Schools- Monhagen Middle School- Snow Emergency Informa (Cultural Attractions- Events- & Facilities; Gardner Avenue Extension), Area Schools - Middletown- Schools- Mechanicstown School- Snow Emergency Informa (Cultural Attractions- Events- & Facilities; 223 Wisner Avenue), Area Schools - Middletown- Schools- Middletown High School- Snow Emergency Informa (Cultural Attractions- Events- & Facilities; Gardner Avenue Extension), Area Schools - Middletown- Schools- Truman J.Moon School- Snow Emergency Informa (Cultural Attractions- Events- & Facilities; 435 East Main Street), Area Schools - Middletown- Schools- Maple Hill Elementary- Snow Emergency Informa (Cultural Attractions- Events- & Facilities; 223 Wisner Avenue).
Hotels: Courtyard By Marriott (24 Crystal Run Crossing), Erie Hotel (126 East Main Street).
Courts: Middletown City - City Court (2 James Street), Tennis Court Surfacing Co (659 North).
Birthplace of: Matt Morris - 2005 Major League Baseball player (St. Louis Cardinals, born: Aug 9, 1974), Mike Remlinger - 2005 Major League Baseball player (Boston Red Sox, born: Mar 23, 1966), Shane McDermott - Actor, Kenny MacCalla - College basketball player (Albany Great Danes), Michael Jantze - Cartoonist.
Drinking water stations with addresses in Middletown and their reported violations in the past:
FAIR OAKS MOBIL MART (Address: 279 BLOOMINGBURG ROAD , Population served: 300, Groundwater):Past health violations:RING HOMESTEAD (Address: 257 LYBOLT ROAD , Population served: 150, Groundwater):Past monitoring violations:
- Treatment Technique (SWTR and GWR) - In JUL-2013, Contaminant: GROUNDWATER RULE. Follow-up actions: St Public Notif requested (JUL-30-2013), St Formal NOV issued (JUL-30-2013), St Compliance achieved (AUG-27-2013)
- 13 routine major monitoring violations
- 272 regular monitoring violations
Past monitoring violations:KORN'S CAMPGROUND (Address: 60 MEYER ROAD , Population served: 93, Groundwater):
- 6 routine major monitoring violations
- One regular monitoring violation
Past health violations:DOS AMIGOS (Population served: 90, Groundwater):Past monitoring violations:
- Treatment Technique (SWTR and GWR) - In MAY-2014, Contaminant: GROUNDWATER RULE. Follow-up actions: St Public Notif requested (MAY-27-2014), St Formal NOV issued (MAY-27-2014), St Compliance achieved (JUN-20-2014)
- Treatment Technique (SWTR and GWR) - In JUN-2013, Contaminant: GROUNDWATER RULE. Follow-up actions: St Public Notif requested (JUN-24-2013), St Formal NOV issued (JUN-24-2013), St Compliance achieved (JUN-27-2013)
- 3 routine major monitoring violations
- One regular monitoring violation
Past health violations:GINNY COUNTRY DELI (Address: 650 ROUTE 211 WEST , Population served: 50, Groundwater):Past monitoring violations:
- Treatment Technique (SWTR and GWR) - In OCT-2013, Contaminant: GROUNDWATER RULE. Follow-up actions: St Formal NOV issued (OCT-31-2013), St Public Notif requested (OCT-31-2013)
- 3 routine major monitoring violations
Past health violations:O'MALLEY'S PUB (Population served: 40, Groundwater):Past monitoring violations:
- Treatment Technique (SWTR and GWR) - In APR-2014, Contaminant: GROUNDWATER RULE. Follow-up actions: St Public Notif requested (APR-15-2014), St Formal NOV issued (APR-15-2014), St Compliance achieved (APR-25-2014)
- Treatment Technique (SWTR and GWR) - In APR-2013, Contaminant: GROUNDWATER RULE. Follow-up actions: St Formal NOV issued (APR-08-2013), St Public Notif requested (APR-08-2013), St Compliance achieved (APR-23-2013)
- 11 routine major monitoring violations
- One regular monitoring violation
Past health violations:RECAP WESTERN OC HEADSTART (Address: 157 LINDEN AVENUE , Population served: 36, Groundwater):Past monitoring violations:
- Treatment Technique (SWTR and GWR) - In OCT-2013, Contaminant: GROUNDWATER RULE. Follow-up actions: St Formal NOV issued (OCT-10-2013), St Public Notif requested (OCT-10-2013)
- 3 routine major monitoring violations
- One regular monitoring violation
Past monitoring violations:HANSEL & GRETEL NURSERY SCHOOL (Address: 632 VAN BURENVILLE ROAD , Population served: 35, Groundwater):
- One routine major monitoring violation
- One regular monitoring violation
Past health violations:Past monitoring violations:
- Treatment Technique (SWTR and GWR) - In APR-2013, Contaminant: GROUNDWATER RULE. Follow-up actions: St Public Notif requested (MAY-17-2013), St Compliance achieved (MAY-17-2013), St Public Notif received (MAY-17-2013), St Formal NOV issued (MAY-17-2013)
- One regular monitoring violation
Drinking water stations with addresses in Middletown that have no violations reported:
| This city: | 2.8 people |
| New York: | 2.6 people |
| This city: | 64.6% |
| Whole state: | 63.5% |
| This city: | 9.7% |
| Whole state: | 6.8% |
Likely homosexual households (counted as self-reported same-sex unmarried-partner households)
- Lesbian couples: 0.5% of all households
- Gay men: 0.2% of all households
People in group quarters in Middletown in 2010:
- 181 people in nursing facilities/skilled-nursing facilities
- 120 people in emergency and transitional shelters (with sleeping facilities) for people experiencing homelessness
- 87 people in group homes intended for adults
- 75 people in other noninstitutional facilities
- 17 people in workers' group living quarters and job corps centers
- 6 people in correctional facilities intended for juveniles
- 3 people in group homes for juveniles (non-correctional)
People in group quarters in Middletown in 2000:
- 216 people in other noninstitutional group quarters
- 191 people in nursing homes
- 72 people in homes for the mentally retarded
- 53 people in homes or halfway houses for drug/alcohol abuse
- 30 people in homes for the mentally ill
- 11 people in religious group quarters
- 8 people in residential treatment centers for emotionally disturbed children
Banks with most branches in Middletown (2011 data):
- Orange County Trust Company: Dunning Road Branch, at 75 North Street, Dolson Avenue Branch. Info updated 2006/11/03: Bank assets: $632.9 mil, Deposits: $447.8 mil, local headquarters, positive income, Commercial Lending Specialization, 9 total offices, Holding Company: Orange County Bancorp, Inc.
- JPMorgan Chase Bank, National Association: Middletown Fairgrounds Plaza Branch at 12 Lloyds Ln, branch established on 2008/11/25; Middletown Branch at 135 North Street, branch established on 1934/01/24. Info updated 2011/11/10: Bank assets: $1,811,678.0 mil, Deposits: $1,190,738.0 mil, headquarters in Columbus, OH, positive income, International Specialization, 5577 total offices, Holding Company: Jpmorgan Chase & Co.
- RBS Citizens, National Association: Middletown East Branch at 253 Route 211 East, branch established on 1974/08/03; Middletown / Walmart Branch at 470 Route 211e, branch established on 2004/09/01. Info updated 2007/09/19: Bank assets: $106,940.6 mil, Deposits: $75,690.2 mil, headquarters in Providence, RI, positive income, 1135 total offices, Holding Company: Uk Financial Investments Limited
- TD Bank, National Association: Orange Plaza Branch at 468 Route 211 East-Orange Plaza, branch established on 1971/11/10; Playtogs Shopping Plaza Branch at 156a-B Dolson Avenue, branch established on 1987/09/28. Info updated 2010/10/04: Bank assets: $188,912.6 mil, Deposits: $153,149.8 mil, headquarters in Wilmington, DE, positive income, 1314 total offices, Holding Company: Toronto-Dominion Bank, The
- Provident Bank: Wallkill Town Center Branch at 485 Schutt Rd, branch established on 1992/10/19; Wallkill East Branch at 1 Industrial Drive, Suite 100, branch established on 1998/07/27. Info updated 2011/07/21: Bank assets: $3,075.6 mil, Deposits: $2,161.0 mil, headquarters in Montebello, NY, positive income, Commercial Lending Specialization, 36 total offices
- Catskill Hudson Bank: Stoneridge Mini Mall Branch at 731 Route 211 East, branch established on 2001/07/12. Info updated 2011/01/31: Bank assets: $351.7 mil, Deposits: $315.6 mil, headquarters in Rock Hill, NY, positive income, Commercial Lending Specialization, 13 total offices, Holding Company: Catskill Hudson Bancorp, Inc.
- Greater Hudson Bank, National Association: at 643 Route 211 East, branch established on 2002/10/15. Info updated 2009/01/06: Bank assets: $299.2 mil, Deposits: $245.8 mil, local headquarters, positive income, Commercial Lending Specialization, 4 total offices
- HSBC Bank USA, National Association: Middletown Branch at 545 Route 211 East, branch established on 1971/11/23. Info updated 2010/11/30: Bank assets: $206,009.7 mil, Deposits: $149,026.8 mil, headquarters in Mc Lean, VA, positive income, 474 total offices, Holding Company: Hsbc Holdings Plc
- Bank of America, National Association: Middletown Branch at 715 Rte 211 East, branch established on 1966/01/29. Info updated 2009/11/18: Bank assets: $1,451,969.3 mil, Deposits: $1,077,176.8 mil, headquarters in Charlotte, NC, positive income, 5782 total offices, Holding Company: Bank Of America Corporation
- 2 other banks with 2 local branches
For population 15 years and over in Middletown:
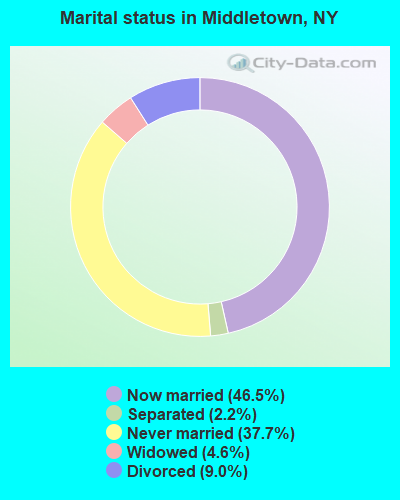
- Never married: 37.7%
- Now married: 46.5%
- Separated: 2.2%
- Widowed: 4.6%
- Divorced: 9.0%
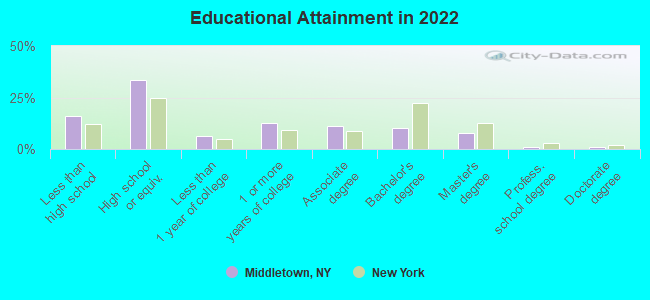
For population 25 years and over in Middletown:
- High school or higher: 84.4%
- Bachelor's degree or higher: 20.2%
- Graduate or professional degree: 9.1%
- Unemployed: 6.4%
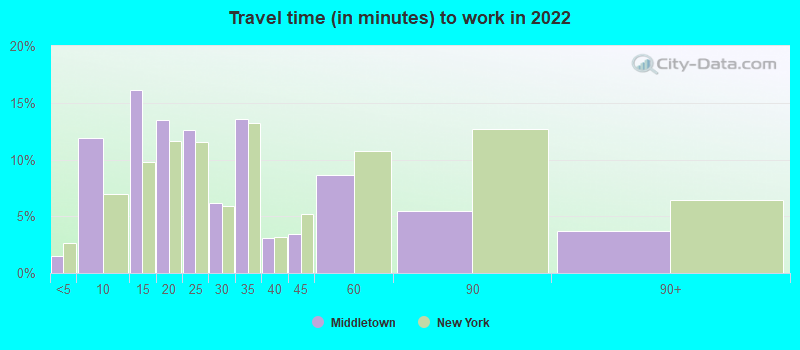
- Mean travel time to work (commute): 29.8 minutes
| Here: | 13.9 |
| New York average: | 13.9 |
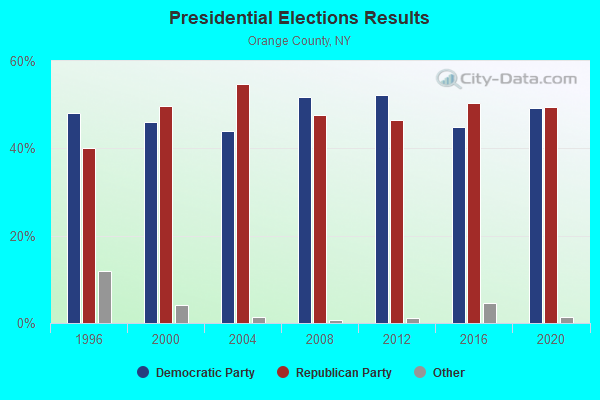
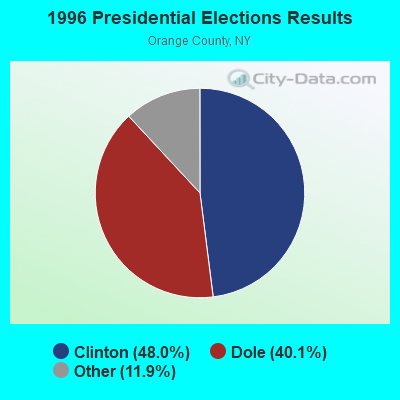
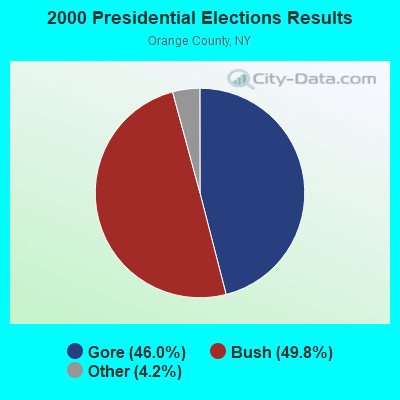
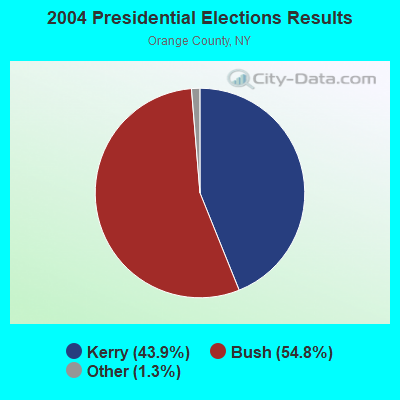
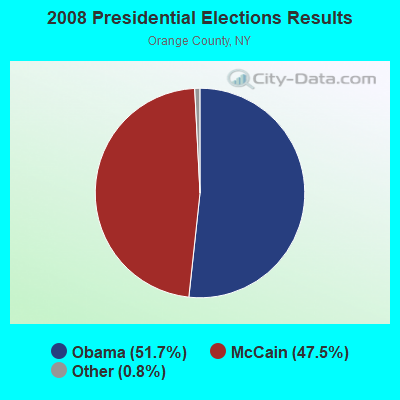
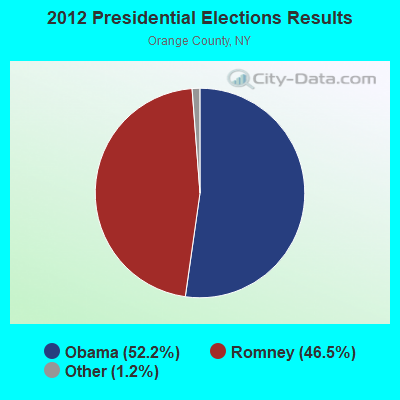
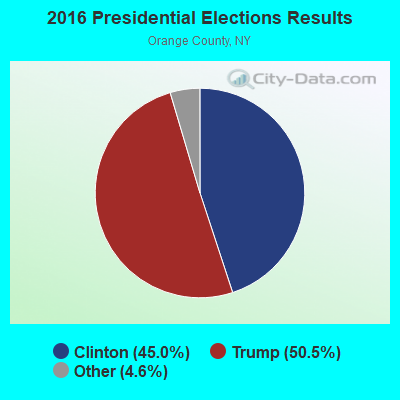

Graphs represent county-level data. Detailed 2008 Election Results
Neighborhoods in Middletown:
(Middletown, New York Neighborhood Map)Religion statistics for Middletown, NY (based on Orange County data)
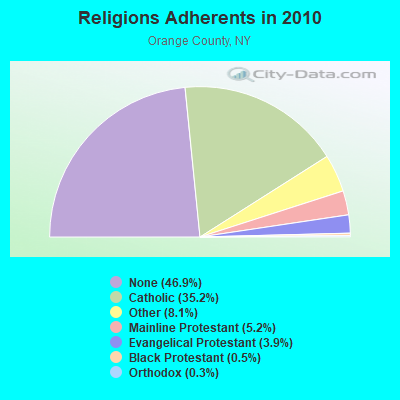
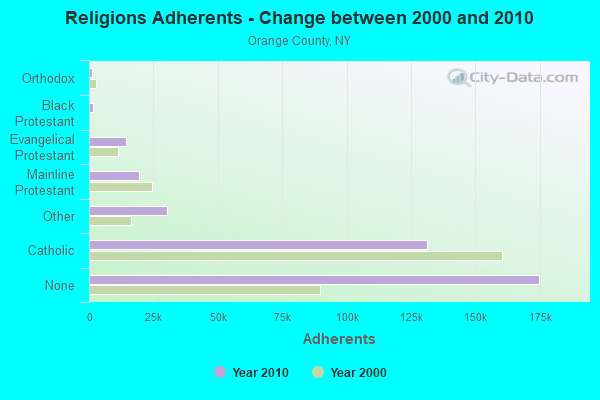
| Religion | Adherents | Congregations |
|---|---|---|
| Catholic | 131,308 | 45 |
| Other | 30,221 | 42 |
| Mainline Protestant | 19,326 | 88 |
| Evangelical Protestant | 14,437 | 95 |
| Black Protestant | 1,711 | 9 |
| Orthodox | 973 | 6 |
| None | 174,837 | - |
Food Environment Statistics:
| Here: | 3.00 / 10,000 pop. |
| State: | 4.13 / 10,000 pop. |
| Here: | 0.11 / 10,000 pop. |
| New York: | 0.06 / 10,000 pop. |
| This county: | 1.22 / 10,000 pop. |
| New York: | 0.92 / 10,000 pop. |
| Orange County: | 2.50 / 10,000 pop. |
| State: | 1.68 / 10,000 pop. |
| Here: | 8.34 / 10,000 pop. |
| New York: | 8.82 / 10,000 pop. |
| This county: | 8.6% |
| New York: | 8.2% |
| Here: | 25.9% |
| New York: | 23.8% |
| Orange County: | 13.3% |
| New York: | 15.6% |
Health and Nutrition:
| Middletown: | 48.9% |
| New York: | 50.1% |
| Here: | 47.2% |
| New York: | 48.1% |
| Here: | 28.8 |
| New York: | 28.5 |
| This city: | 20.5% |
| State: | 20.3% |
| This city: | 11.0% |
| State: | 11.1% |
| Middletown: | 6.8 |
| State: | 6.8 |
| Here: | 33.6% |
| New York: | 33.4% |
| Middletown: | 56.2% |
| New York: | 56.5% |
| Middletown: | 80.4% |
| New York: | 80.2% |
More about Health and Nutrition of Middletown, NY Residents
| Local government employment and payroll (March 2022) | |||||
| Function | Full-time employees | Monthly full-time payroll | Average yearly full-time wage | Part-time employees | Monthly part-time payroll |
|---|---|---|---|---|---|
| Police Protection - Officers | 70 | $666,942 | $114,333 | 0 | $0 |
| Firefighters | 25 | $203,784 | $97,816 | 0 | $0 |
| Other Government Administration | 24 | $167,579 | $83,790 | 15 | $23,921 |
| Streets and Highways | 14 | $67,577 | $57,923 | 4 | $16,543 |
| Water Supply | 14 | $80,959 | $69,393 | 0 | $0 |
| Police - Other | 13 | $69,172 | $63,851 | 11 | $6,597 |
| Parks and Recreation | 12 | $69,096 | $69,096 | 27 | $23,146 |
| Solid Waste Management | 11 | $62,213 | $67,869 | 1 | $1,403 |
| Financial Administration | 10 | $55,921 | $67,105 | 0 | $0 |
| Sewerage | 6 | $38,936 | $77,872 | 0 | $0 |
| Housing and Community Development (Local) | 4 | $21,153 | $63,459 | 2 | $2,619 |
| Welfare | 4 | $16,143 | $48,429 | 3 | $6,061 |
| Judicial and Legal | 2 | $7,536 | $45,216 | 2 | $4,002 |
| Health | 1 | $5,027 | $60,324 | 0 | $0 |
| Totals for Government | 210 | $1,532,037 | $87,545 | 65 | $84,293 |
Middletown government finances - Expenditure in 2021 (per resident):
- Construction - Regular Highways: $7,700,000 ($254.91)
Sewerage: $1,530,000 ($50.65)
Water Utilities: $1,351,000 ($44.72)
Parks and Recreation: $1,247,000 ($41.28)
Police Protection: $1,009,000 ($33.40)
General - Other: $706,000 ($23.37)
Local Fire Protection: $331,000 ($10.96)
Solid Waste Management: $124,000 ($4.11)
- Current Operations - General - Other: $16,639,000 ($550.83)
Police Protection: $9,397,000 ($311.09)
Water Utilities: $3,927,000 ($130.00)
Sewerage: $3,356,000 ($111.10)
Local Fire Protection: $2,993,000 ($99.08)
Solid Waste Management: $2,340,000 ($77.47)
Parks and Recreation: $2,153,000 ($71.27)
Regular Highways: $1,289,000 ($42.67)
Financial Administration: $1,085,000 ($35.92)
Central Staff Services: $783,000 ($25.92)
General Public Buildings: $537,000 ($17.78)
Housing and Community Development: $456,000 ($15.10)
Judicial and Legal Services: $209,000 ($6.92)
- General - Interest on Debt: $3,101,000 ($102.66)
- Intergovernmental to Local - Other - Financial Administration: $179,000 ($5.93)
- Other Capital Outlay - Sewerage: $440,000 ($14.57)
Regular Highways: $297,000 ($9.83)
Local Fire Protection: $160,000 ($5.30)
Police Protection: $142,000 ($4.70)
Water Utilities: $121,000 ($4.01)
Parks and Recreation: $95,000 ($3.14)
General - Other: $58,000 ($1.92)
Solid Waste Management: $25,000 ($0.83)
General Public Building: $5,000 ($0.17)
Judicial and Legal Services: $2,000 ($0.07)
Central Staff Services: $2,000 ($0.07)
- Total Salaries and Wages: $19,941,000 ($660.14)
- Water Utilities - Interest on Debt: $134,000 ($4.44)
Middletown government finances - Revenue in 2021 (per resident):
- Charges - Sewerage: $5,743,000 ($190.12)
Other: $935,000 ($30.95)
Parks and Recreation: $82,000 ($2.71)
- Federal Intergovernmental - Other: $2,248,000 ($74.42)
Housing and Community Development: $563,000 ($18.64)
- Local Intergovernmental - General Local Government Support: $10,257,000 ($339.56)
Other: $27,000 ($0.89)
- Miscellaneous - General Revenue - Other: $2,605,000 ($86.24)
Sale of Property: $419,000 ($13.87)
Interest Earnings: $227,000 ($7.51)
Fines and Forfeits: $222,000 ($7.35)
Rents: $175,000 ($5.79)
- Revenue - Water Utilities: $7,473,000 ($247.39)
- State Intergovernmental - General Local Government Support: $2,565,000 ($84.91)
Other: $1,604,000 ($53.10)
Education: $622,000 ($20.59)
- Tax - Property: $20,286,000 ($671.57)
Other License: $837,000 ($27.71)
Public Utilities Sales: $792,000 ($26.22)
Other: $2,000 ($0.07)
Middletown government finances - Debt in 2021 (per resident):
- Long Term Debt - Beginning Outstanding - Unspecified Public Purpose: $50,396,000 ($1668.36)
Outstanding Unspecified Public Purpose: $47,369,000 ($1568.15)
Retired Unspecified Public Purpose: $3,028,000 ($100.24)
- Short Term Debt Outstanding - End of Fiscal Year: $48,779,000 ($1614.82)
Beginning: $31,928,000 ($1056.97)
Middletown government finances - Cash and Securities in 2021 (per resident):
- Bond Funds - Cash and Securities: $36,637,000 ($1212.86)
- Other Funds - Cash and Securities: $9,194,000 ($304.37)
- Sinking Funds - Cash and Securities: $5,831,000 ($193.03)
6.30% of this county's 2021 resident taxpayers lived in other counties in 2020 ($81,451 average adjusted gross income)
| Here: | 6.30% |
| New York average: | 5.29% |
0.03% of residents moved from foreign countries ($369 average AGI)
Orange County: 0.03% New York average: 0.01%
Top counties from which taxpayers relocated into this county between 2020 and 2021:
| from Bronx County, NY | |
| from Kings County, NY | |
| from Rockland County, NY |
6.58% of this county's 2020 resident taxpayers moved to other counties in 2021 ($77,430 average adjusted gross income)
| Here: | 6.58% |
| New York average: | 6.93% |
0.03% of residents moved to foreign countries ($315 average AGI)
Orange County: 0.03% New York average: 0.02%
Top counties to which taxpayers relocated from this county between 2020 and 2021:
| to Ulster County, NY | |
| to Dutchess County, NY | |
| to Sullivan County, NY |
| Businesses in Middletown, NY | ||||
| Name | Count | Name | Count | |
|---|---|---|---|---|
| ALDI | 1 | La-Z-Boy | 2 | |
| ALDO | 1 | Lane Bryant | 1 | |
| AT&T | 2 | LensCrafters | 1 | |
| Ace Hardware | 1 | Lowe's | 1 | |
| Advance Auto Parts | 1 | Macy's | 1 | |
| Aeropostale | 1 | Marriott | 1 | |
| American Eagle Outfitters | 1 | Marshalls | 1 | |
| Applebee's | 1 | MasterBrand Cabinets | 9 | |
| Arby's | 1 | McDonald's | 2 | |
| Ashley Furniture | 1 | Men's Wearhouse | 1 | |
| AutoZone | 2 | Microtel | 1 | |
| Avenue | 1 | Motherhood Maternity | 2 | |
| Baskin-Robbins | 1 | New Balance | 2 | |
| Bath & Body Works | 2 | New York & Co | 1 | |
| Bed Bath & Beyond | 1 | Nike | 9 | |
| Blockbuster | 1 | Old Navy | 1 | |
| Brookstone | 1 | Olive Garden | 1 | |
| Burger King | 1 | Pac Sun | 1 | |
| Burlington Coat Factory | 1 | Panera Bread | 1 | |
| CVS | 1 | Papa John's Pizza | 1 | |
| Casual Male XL | 1 | Payless | 2 | |
| Catherines | 1 | Penske | 1 | |
| Chuck E. Cheese's | 1 | PetSmart | 1 | |
| DHL | 1 | Pier 1 Imports | 1 | |
| Dennys | 1 | Pizza Hut | 1 | |
| Domino's Pizza | 1 | RadioShack | 2 | |
| DressBarn | 1 | Raymour & Flanigan | 1 | |
| Dressbarn | 1 | Red Lobster | 1 | |
| Dunkin Donuts | 4 | Rite Aid | 4 | |
| Express | 1 | Ruby Tuesday | 1 | |
| Famous Footwear | 1 | SAS Shoes | 2 | |
| Fashion Bug | 2 | Sam's Club | 1 | |
| FedEx | 7 | Sears | 3 | |
| Finish Line | 1 | Sephora | 1 | |
| Firestone Complete Auto Care | 1 | Spencer Gifts | 1 | |
| Forever 21 | 1 | Sprint Nextel | 3 | |
| GNC | 3 | Staples | 1 | |
| GameStop | 2 | Starbucks | 1 | |
| Gap | 1 | Subaru | 1 | |
| Gymboree | 1 | Subway | 7 | |
| H&M | 1 | Super 8 | 1 | |
| H&R Block | 4 | T-Mobile | 5 | |
| Hilton | 1 | T.G.I. Driday's | 1 | |
| Hobby Lobby | 1 | T.J.Maxx | 1 | |
| Holiday Inn | 1 | Taco Bell | 2 | |
| Hollister Co. | 1 | Target | 1 | |
| Home Depot | 1 | The Room Place | 1 | |
| Honda | 1 | Toys"R"Us | 3 | |
| Hot Topic | 1 | U-Haul | 3 | |
| Howard Johnson | 1 | UPS | 11 | |
| IHOP | 1 | Vans | 3 | |
| JCPenney | 1 | Verizon Wireless | 3 | |
| Johnny Rockets | 1 | Victoria's Secret | 1 | |
| Jones New York | 3 | Volkswagen | 1 | |
| Journeys | 1 | Walmart | 1 | |
| Justice | 1 | Wendy's | 3 | |
| KFC | 1 | Wet Seal | 1 | |
| Kroger | 1 | YMCA | 1 | |
Strongest AM radio stations in Middletown:
- WALL (1340 AM; 1 kW; MIDDLETOWN, NY; Owner: CUMULUS LICENSING CORP.)
- WABC (770 AM; 50 kW; NEW YORK, NY; Owner: WABC-AM RADIO, INC.)
- WMCA (570 AM; 50 kW; NEW YORK, NY; Owner: SALEM MEDIA OF NEW YORK, LLC)
- WOR (710 AM; 50 kW; NEW YORK, NY; Owner: BUCKLEY BROADCASTING CORPORATION)
- WGNY (1220 AM; 10 kW; NEWBURGH, NY; Owner: SUNRISE BROADCASTING LLC)
- WFAN (660 AM; 50 kW; NEW YORK, NY; Owner: INFINITY BROADCASTING OPERATIONS, INC.)
- WSNR (620 AM; 20 kW; JERSEY CITY, NJ)
- WINS (1010 AM; 50 kW; NEW YORK, NY; Owner: INFINITY BROADCASTING OPERATIONS, INC.)
- WVNJ (1160 AM; 20 kW; OAKLAND, NJ; Owner: UNIVERSAL B/CASTING OF NEW YORK,INC.)
- WEPN (1050 AM; 50 kW; NEW YORK, NY; Owner: NEW YORK AM RADIO, LLC)
- WCBS (880 AM; 50 kW; NEW YORK, NY; Owner: INFINITY BROADCASTING OPERATIONS, INC.)
- WBBR (1130 AM; 50 kW; NEW YORK, NY; Owner: BLOOMBERG COMMUNICATIONS INC.)
- WADO (1280 AM; 50 kW; NEW YORK, NY; Owner: WADO-AM LICENSE CORP.)
Strongest FM radio stations in Middletown:
- WRRV (92.7 FM; MIDDLETOWN, NY; Owner: CUMULUS LICENSING CORP.)
- W229AA (93.7 FM; MIDDLETOWN, NY; Owner: SUSAN CLINTON)
- W295AA (106.9 FM; MIDDLETOWN, NY; Owner: SUSAN CLINTON)
- W239AC (95.7 FM; MIDDLETOWN, NY; Owner: JOHN KATONAH)
- WFKP (99.3 FM; ELLENVILLE, NY; Owner: CLEAR CHANNEL BROADCASTING LICENSES, INC.)
- WXHD (90.1 FM; MOUNT HOPE, NY; Owner: AURICLE COMMUNICATIONS)
- WRPJ (88.9 FM; PORT JERVIS, NY; Owner: SOUND OF LIFE, INC.)
- WLJP (89.3 FM; MONROE, NY; Owner: SOUND OF LIFE, INC.)
- WZAD (97.3 FM; WURTSBORO, NY; Owner: CUMULUS LICENSING CORP.)
- WOSR (91.7 FM; MIDDLETOWN, NY; Owner: WAMC)
- WSPK (104.7 FM; POUGHKEEPSIE, NY; Owner: 6 JOHNSON ROAD LICENSES, INC.)
- WPDH (101.5 FM; POUGHKEEPSIE, NY; Owner: CUMULUS LICENSING CORP.)
- WFNP (88.7 FM; ROSENDALE, NY; Owner: STATE UNIVERSITY OF NEW YORK)
- WRHV (88.7 FM; POUGHKEEPSIE, NY; Owner: WMHT EDUCATIONAL TELECOMMUNICATIONS)
- WTSX (96.7 FM; PORT JERVIS, NY; Owner: PORT JERVIS BROADCASTING CO., INC.)
- WSUS (102.3 FM; FRANKLIN, NJ; Owner: CLEAR CHANNEL BROADCASTING LICENSES, INC.)
- WCZX (97.7 FM; HYDE PARK, NY; Owner: CUMULUS LICENSING CORP.)
- WBWZ (93.3 FM; NEW PALTZ, NY; Owner: CLEVELAND RADIO LICENSES, LLC)
- WRWD-FM (107.3 FM; HIGHLAND, NY; Owner: CLEVELAND RADIO LICENSES, LLC)
- WRRB (96.9 FM; ARLINGTON, NY; Owner: CUMULUS LICENSING CORP.)
TV broadcast stations around Middletown:
- WFME-TV (Channel 66; WEST MILFORD, NJ; Owner: FAMILY STATIONS, INC.)
- WTBY (Channel 54; POUGHKEEPSIE, NY; Owner: TRINITY BROADCASTING OF NEW YORK, INC.)
- WNYW (Channel 5; NEW YORK, NY; Owner: FOX TELEVISION STATIONS, INC.)
- WCBS-TV (Channel 2; NEW YORK, NY; Owner: CBS BROADCASTING INC.)
- WNJU (Channel 47; LINDEN, NJ; Owner: WNJU LICENSE CORPORATION)
- WPXN-TV (Channel 31; NEW YORK, NY; Owner: PAXSON COMMUNICATIONS LICENSE COMPANY, LLC)
- WPXO-LP (Channel 34; EAST ORANGE, NJ; Owner: PAXSON COMMUNICATIONS LPTV, INC.)
- WFUT (Channel 68; NEWARK, NJ; Owner: UNIVISION NEW YORK LLC)
- WMBC-TV (Channel 63; NEWTON, NJ; Owner: MOUNTAIN BROADCASTING CORPORATION)
Medal of Honor Recipients
Medal of Honor Recipient born in Middletown: Frank W. Mills.
- National Bridge Inventory (NBI) Statistics
- 6Number of bridges
- 23ft / 7.0mTotal length
- $5,722,000Total costs
- 14,342Total average daily traffic
- 480Total average daily truck traffic
FCC Registered Commercial Land Mobile Towers: 1 (See the full list of FCC Registered Commercial Land Mobile Towers in Middletown, NY)
FCC Registered Private Land Mobile Towers: 4 (See the full list of FCC Registered Private Land Mobile Towers)
FCC Registered Broadcast Land Mobile Towers: 38 (See the full list of FCC Registered Broadcast Land Mobile Towers)
FCC Registered Microwave Towers: 14 (See the full list of FCC Registered Microwave Towers in this town)
FCC Registered Paging Towers: 9 (See the full list of FCC Registered Paging Towers)
FCC Registered Maritime Coast & Aviation Ground Towers: 1 (See the full list of FCC Registered Maritime Coast & Aviation Ground Towers)
FCC Registered Amateur Radio Licenses: 160 (See the full list of FCC Registered Amateur Radio Licenses in Middletown)
FAA Registered Aircraft: 32 (See the full list of FAA Registered Aircraft in Middletown)
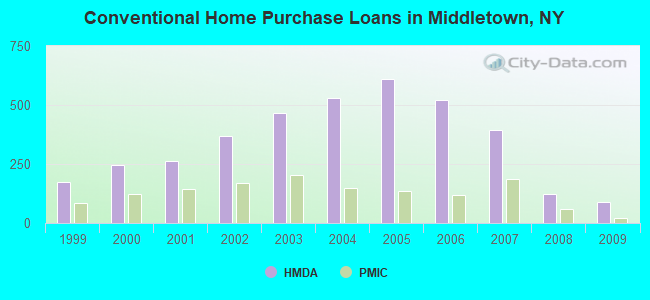
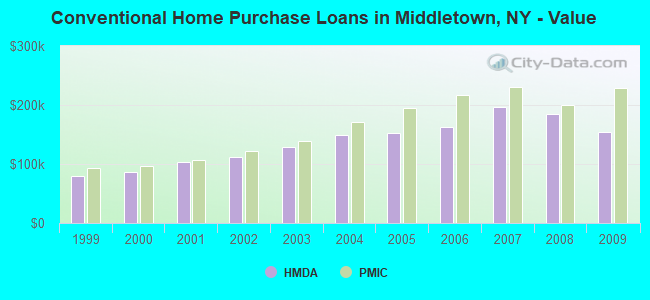
| Home Mortgage Disclosure Act Aggregated Statistics For Year 2009 (Based on 5 full and 2 partial tracts) | ||||||||||||||
| A) FHA, FSA/RHS & VA Home Purchase Loans | B) Conventional Home Purchase Loans | C) Refinancings | D) Home Improvement Loans | E) Loans on Dwellings For 5+ Families | F) Non-occupant Loans on < 5 Family Dwellings (A B C & D) | G) Loans On Manufactured Home Dwelling (A B C & D) | ||||||||
|---|---|---|---|---|---|---|---|---|---|---|---|---|---|---|
| Number | Average Value | Number | Average Value | Number | Average Value | Number | Average Value | Number | Average Value | Number | Average Value | Number | Average Value | |
| LOANS ORIGINATED | 125 | $220,130 | 91 | $154,268 | 110 | $162,520 | 18 | $62,123 | 1 | $338,000 | 19 | $97,689 | 0 | $0 |
| APPLICATIONS APPROVED, NOT ACCEPTED | 13 | $196,529 | 8 | $146,580 | 26 | $181,913 | 2 | $59,425 | 0 | $0 | 1 | $225,030 | 0 | $0 |
| APPLICATIONS DENIED | 25 | $217,793 | 35 | $139,322 | 163 | $203,257 | 40 | $45,164 | 2 | $759,000 | 16 | $143,868 | 2 | $22,430 |
| APPLICATIONS WITHDRAWN | 13 | $240,361 | 11 | $148,846 | 83 | $188,262 | 3 | $117,667 | 0 | $0 | 4 | $107,712 | 0 | $0 |
| FILES CLOSED FOR INCOMPLETENESS | 6 | $167,640 | 1 | $125,000 | 23 | $170,717 | 1 | $50,000 | 0 | $0 | 2 | $225,030 | 0 | $0 |
Detailed HMDA statistics for the following Tracts: 0011.00 , 0012.00, 0013.00, 0014.00, 0015.00, 0016.00, 0017.00
| Private Mortgage Insurance Companies Aggregated Statistics For Year 2009 (Based on 5 full and 2 partial tracts) | ||||||
| A) Conventional Home Purchase Loans | B) Refinancings | C) Non-occupant Loans on < 5 Family Dwellings (A & B) | ||||
|---|---|---|---|---|---|---|
| Number | Average Value | Number | Average Value | Number | Average Value | |
| LOANS ORIGINATED | 21 | $228,647 | 2 | $148,100 | 0 | $0 |
| APPLICATIONS APPROVED, NOT ACCEPTED | 10 | $158,273 | 2 | $133,630 | 3 | $125,780 |
| APPLICATIONS DENIED | 6 | $129,437 | 5 | $194,364 | 0 | $0 |
| APPLICATIONS WITHDRAWN | 6 | $195,073 | 2 | $171,845 | 0 | $0 |
| FILES CLOSED FOR INCOMPLETENESS | 3 | $171,183 | 0 | $0 | 0 | $0 |
Detailed PMIC statistics for the following Tracts: 0011.00 , 0012.00, 0013.00, 0014.00, 0015.00, 0016.00, 0017.00
2002 - 2018 National Fire Incident Reporting System (NFIRS) incidents
- Fire incident types reported to NFIRS in Middletown, NY
- 1,39741.3%Structure Fires
- 1,08332.0%Outside Fires
- 51715.3%Mobile Property/Vehicle Fires
- 38411.4%Other
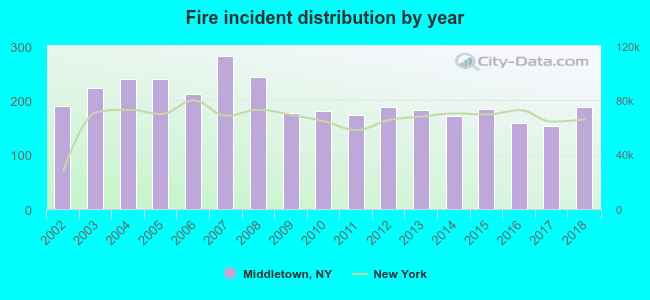 According to the data from the years 2002 - 2018 the average number of fire incidents per year is 199. The highest number of fire incidents - 281 took place in 2007, and the least - 153 in 2017. The data has a declining trend.
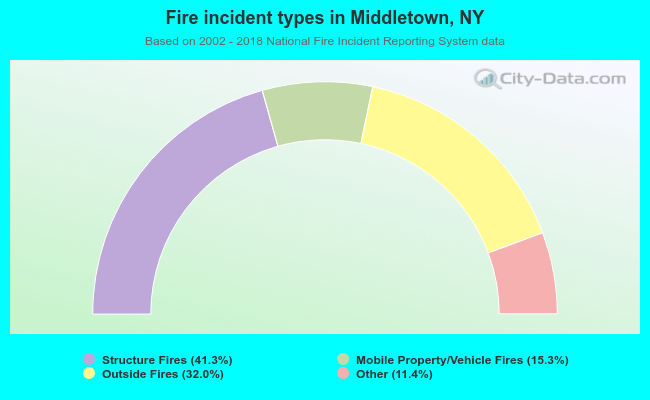 When looking into fire subcategories, the most reports belonged to: Structure Fires (41.3%), and Outside Fires (32.0%).
Fire-safe hotels and motels in Middletown, New York:
- Hampton Inn, 20 Crystal Run Xing, Middletown, New York 10941 , Phone: (845) 344-3400, Fax: (845) 344-3403
- Courtyard By Marriott, 24 Crystal Run Xing, Middletown, New York 10941 , Phone: (845) 695-0606, Fax: (845) 695-0607
- Microtel Inn And Suites, 19 Crystal Run Xing, Middletown, New York 10941 , Phone: (845) 692-0098, Fax: (845) 692-0078
- Home2 Suites by Hilton Middletown, 600 Rt 211 E, Middletown, New York 10941 , Phone: (845) 703-8000, Fax: (845) 703-8001
- Super 8 Middletown, 563 Rt 211 E, Middletown, New York 10941 , Phone: (845) 457-3143, Fax: (845) 457-3143
- Sleep Inn & Suites, 3491 Rt 6, Middletown, New York 10940 , Phone: (845) 342-4304, Fax: (845) 342-4305
- Tru by Hilton Middletown, 41 Dunning Rd, Middletown, New York 10940 , Phone: (845) 343-4100
- Holiday Inn Express & Suites Middletown-Goshen, 20 Med Parc Rd, Middletown, New York 10940 , Phone: (845) 457-9666
| Most common first names in Middletown, NY among deceased individuals | ||
| Name | Count | Lived (average) |
|---|---|---|
| Mary | 424 | 80.9 years |
| John | 421 | 74.1 years |
| William | 384 | 74.4 years |
| Joseph | 277 | 74.7 years |
| Charles | 232 | 75.4 years |
| Helen | 223 | 79.8 years |
| James | 214 | 72.7 years |
| Frank | 213 | 75.9 years |
| George | 208 | 73.7 years |
| Anna | 195 | 81.9 years |
| Most common last names in Middletown, NY among deceased individuals | ||
| Last name | Count | Lived (average) |
|---|---|---|
| Smith | 162 | 75.7 years |
| Miller | 71 | 76.5 years |
| Brown | 69 | 74.3 years |
| Decker | 67 | 76.1 years |
| Davis | 50 | 73.7 years |
| Johnson | 49 | 74.7 years |
| Williams | 49 | 71.3 years |
| Clark | 45 | 73.7 years |
| Moore | 42 | 70.2 years |
| Lewis | 41 | 77.1 years |
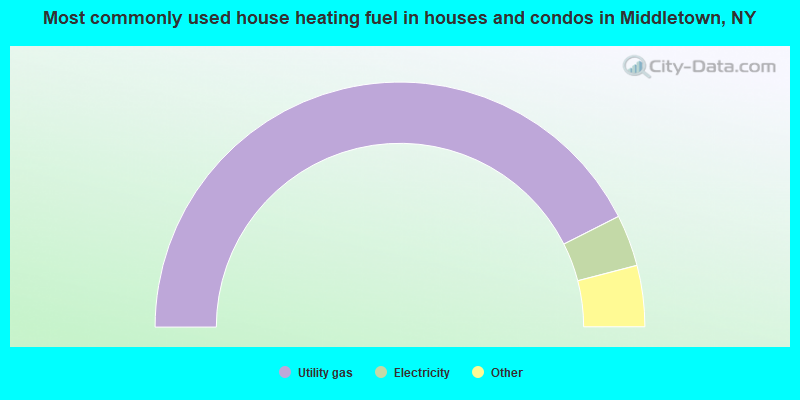
- 85.2%Utility gas
- 6.8%Electricity
- 3.0%Fuel oil, kerosene, etc.
- 2.2%No fuel used
- 2.0%Bottled, tank, or LP gas
- 0.5%Wood
- 0.4%Coal or coke
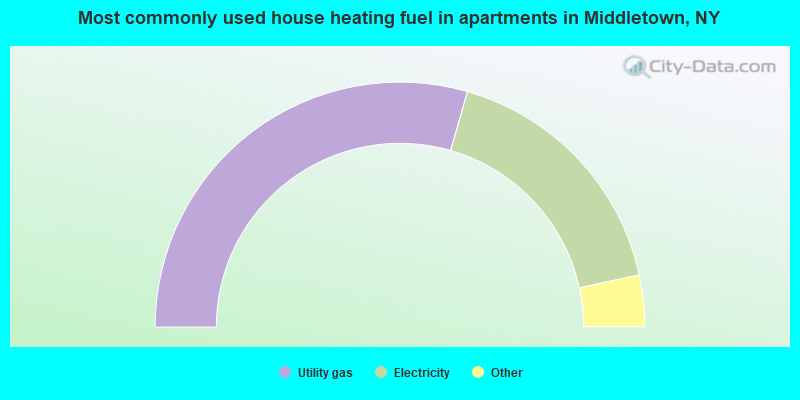
- 58.9%Utility gas
- 34.3%Electricity
- 2.3%Bottled, tank, or LP gas
- 2.2%Fuel oil, kerosene, etc.
- 1.0%No fuel used
- 0.9%Wood
- 0.3%Other fuel
Middletown compared to New York state average:
- Median house value below state average.
- Unemployed percentage below state average.
- Black race population percentage above state average.
- Hispanic race population percentage above state average.
- Median age below state average.
Middletown on our top lists:
- #17 on the list of "Top 101 cities with the most people taking a taxi to work (population 5,000+)"
- #100 on the list of "Top 101 cities with the most residents born in Ecuador (population 500+)"
- #5 on the list of "Top 101 counties with the largest increase in the number of infant deaths per 1000 residents 2000-2006 to 2007-2013 (pop. 50,000+)"
- #21 on the list of "Top 101 counties with the lowest Ozone (1-hour) air pollution readings in 2012 (ppm)"
- #67 on the list of "Top 101 counties with the largest number of people moving out compared to moving in (pop. 50,000+)"
- #79 on the list of "Top 101 counties with the most Catholic congregations"
- #90 on the list of "Top 101 counties with the most Other adherents (pop. 50,000+)"

|
|
Total of 110 patent applications in 2008-2024.