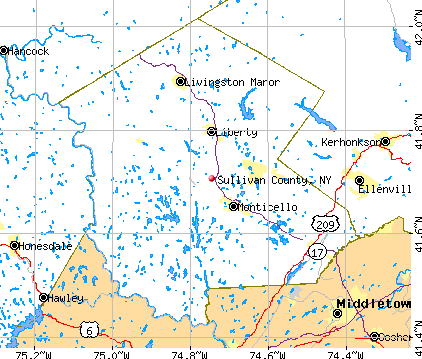
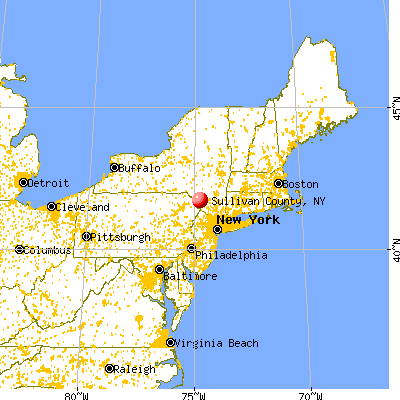
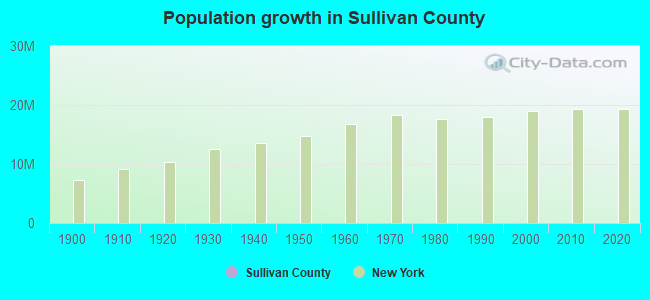
Sullivan County, New York (NY)
County owner-occupied free and clear houses and condos in 2010: 8,121
County owner-occupied houses and condos in 2000: 18,845
Renter-occupied apartments: 9,932 (it was 8,816 in 2000)
| % of renters here: | 32% |
| State: | 47% |
Land area: 970 sq. mi.
Water area: 27.1 sq. mi.
Population density: 82 people per square mile (average).
Industries providing employment: Educational, health and social services (29.3%), Arts, entertainment, recreation, accommodation and food services (10.9%), Retail trade (10.8%).
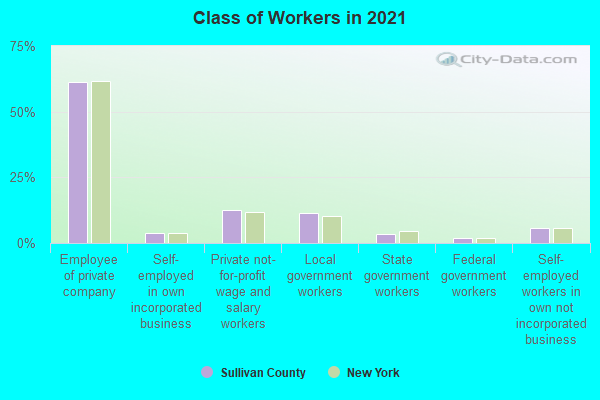
Type of workers:
- Private wage or salary: 72%
- Government: 19%
- Self-employed, not incorporated: 9%
- Unpaid family work: 0%
- OSM Map
- General Map
- Google Map
- MSN Map

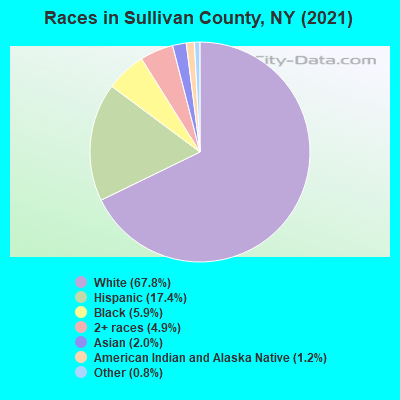
- 52,73966.2%White Non-Hispanic Alone
- 14,59718.3%Hispanic or Latino
- 5,9107.4%Black Non-Hispanic Alone
- 3,9184.9%Two or more races
- 1,8692.3%Asian alone
- 5720.7%Some other race alone
- 530.07%American Indian and Alaska Native alone
| Median resident age: | 41.6 years |
| New York median age: | 40.0 years |
| Males: 41,770 | |
| Females: 37,888 |

 | Moving from Brooklyn. Jewish communities upstate? (343 replies) |
| Why don't we have a Hudson Valley forum? (67 replies) |
| If you were to consolidate governmental entities..... (126 replies) |
| For those interested in Technology and Economic activity in Upstate NY... (2825 replies) |
| Graduation videos… (38 replies) |
| Hispanic/Latino communities in Upstate NY (823 replies) |
| Sullivan County: | 2.0 people |
| New York: | 3 people |
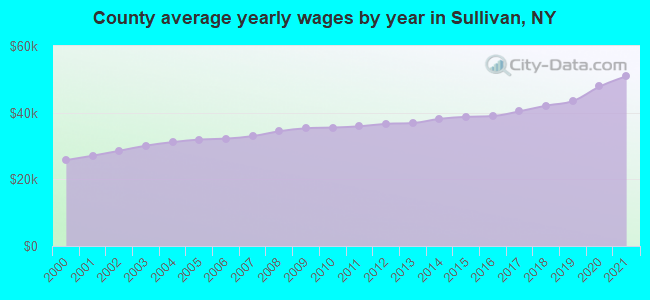
Estimated median household income in 2022: $63,777 ($36,998 in 1999)
| This county: | $63,777 |
| New York: | $79,557 |
Median contract rent in 2022 for apartments: $811 (lower quartile is $596, upper quartile is $1,106)
| This county: | $811 |
| State: | $1354 |
Estimated median house or condo value in 2022: $274,800 (it was $90,400 in 2000)
| Sullivan: | $274,800 |
| New York: | $400,400 |
Mean price in 2022:
Median monthly housing costs for homes and condos with a mortgage: $1,863Detached houses: $296,292
Here: $296,292 State: $476,719 Townhouses or other attached units: $279,664
Here: $279,664 State: $699,270 In 2-unit structures: $506,859
Here: $506,859 State: $713,077 In 3-to-4-unit structures: $161,643
Here: $161,643 State: $764,568 In 5-or-more-unit structures: $372,499
Here: $372,499 State: $912,009 Mobile homes: $81,693
Here: $81,693 State: $88,925
Median monthly housing costs for units without a mortgage: $782
Institutionalized population: 2,009
Crime in 2020 (reported by the sheriff's office or county police, not the county total):
- Murders: 3
- Rapes: 3
- Robberies: 2
- Assaults: 15
- Burglaries: 24
- Thefts: 191
- Auto thefts: 7
Crime in 2019 (reported by the sheriff's office or county police, not the county total):
- Murders: 0
- Rapes: 6
- Robberies: 1
- Assaults: 20
- Burglaries: 34
- Thefts: 234
- Auto thefts: 5
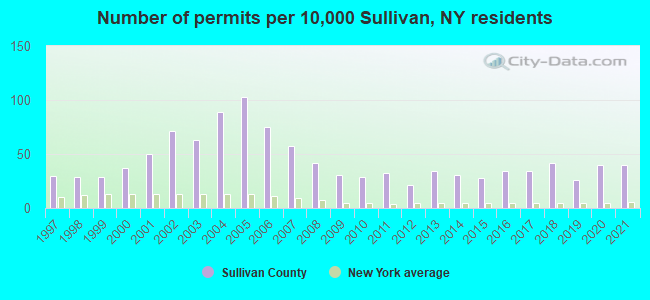
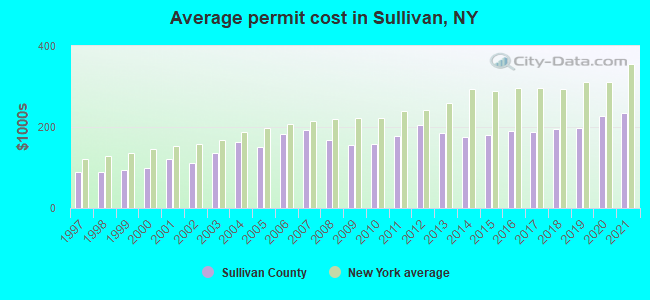
Single-family new house construction building permits:
- 2022: 400 buildings, average cost: $278,500
- 2021: 296 buildings, average cost: $234,900
- 2020: 297 buildings, average cost: $225,500
- 2019: 194 buildings, average cost: $196,700
- 2018: 307 buildings, average cost: $195,400
- 2017: 250 buildings, average cost: $187,400
- 2016: 250 buildings, average cost: $189,700
- 2015: 208 buildings, average cost: $181,200
- 2014: 228 buildings, average cost: $175,300
- 2013: 250 buildings, average cost: $184,200
- 2012: 158 buildings, average cost: $205,300
- 2011: 233 buildings, average cost: $178,100
- 2010: 216 buildings, average cost: $156,800
- 2009: 226 buildings, average cost: $156,300
- 2008: 313 buildings, average cost: $167,600
- 2007: 420 buildings, average cost: $191,800
- 2006: 554 buildings, average cost: $183,000
- 2005: 761 buildings, average cost: $150,800
- 2004: 656 buildings, average cost: $161,900
- 2003: 467 buildings, average cost: $137,200
- 2002: 527 buildings, average cost: $110,600
- 2001: 372 buildings, average cost: $121,500
- 2000: 277 buildings, average cost: $97,800
- 1999: 213 buildings, average cost: $93,700
- 1998: 213 buildings, average cost: $89,600
- 1997: 220 buildings, average cost: $88,400
Median real estate property taxes paid for housing units with mortgages in 2022: $5,392 (1.7%)
Median real estate property taxes paid for housing units with no mortgage in 2022: $4,261 (1.7%)
| Sullivan County: | 16.4% |
| New York: | 14.3% |
Median age of residents in 2022: 41.6 years old
(Males: 41.4 years old, Females: 41.6 years old)
(Median age for: White residents: 46.8 years old, Black residents: 39.6 years old, American Indian residents: 21.8 years old, Asian residents: 40.4 years old, Hispanic or Latino residents: 30.9 years old, Other race residents: 39.4 years old)
Fair market rent in 2006 for a 1-bedroom apartment in Sullivan County is $541 a month.
Fair market rent for a 2-bedroom apartment is $694 a month.
Fair market rent for a 3-bedroom apartment is $831 a month.
Cities in this county include: Thompson, Fallsburg, Mamakating, Monticello, Bethel, Liberty, Rockland, Neversink, Delaware, South Fallsburg.
| City or Town | Homes measured | Living Area | Basement | ||
|---|---|---|---|---|---|
| Homes Above 4 pCi/L Best Estimate (%) | Homes Above 4 pCi/L Range (%) | Homes Above 4 pCi/L Best Estimate (%) | Homes Above 4 pCi/L Range (%) | ||
| Bethel town | 17 | 6 | 3 - 9 | 23 | 17 - 28 |
| Callicoon town | 7 | 6 | 3 - 9 | 24 | 18 - 31 |
| Cochecton town | 0 | 6 | 2 - 10 | 25 | 16 - 32 |
| Delaware town | 8 | 7 | 4 - 11 | 26 | 20 - 32 |
| Fallsburg town | 21 | 5 | 3 - 8 | 25 | 20 - 30 |
| Forestburgh town | 2 | 5 | 2 - 9 | 22 | 14 - 30 |
| Fremont town | 6 | 6 | 3 - 11 | 26 | 21 - 36 |
| Highland town | 3 | 4 | 1 - 8 | 22 | 12 - 29 |
| Liberty town | 28 | 8 | 5 - 11 | 26 | 21 - 31 |
| Lumberland town | 3 | 5 | 2 - 8 | 23 | 15 - 29 |
| Mamakating town | 19 | 5 | 3 - 9 | 25 | 19 - 31 |
| Neversink town | 8 | 4 | 1 - 8 | 22 | 14 - 29 |
| Rockland town | 19 | 11 | 8 - 16 | 34 | 28 - 44 |
| Thompson town | 43 | 6 | 4 - 9 | 23 | 18 - 27 |
| Tusten town | 4 | 5 | 1 - 9 | 24 | 15 - 30 |
| Sullivan county | 188 | 7 | 25 | ||
Neighboring counties: Box Elder County, Utah  , Boyd County, Nebraska , Cortland County
  , Morgan County, Utah , Washoe County, Nevada , Clinton County, Pennsylvania , Lake County, Oregon , Sarpy County, Nebraska .
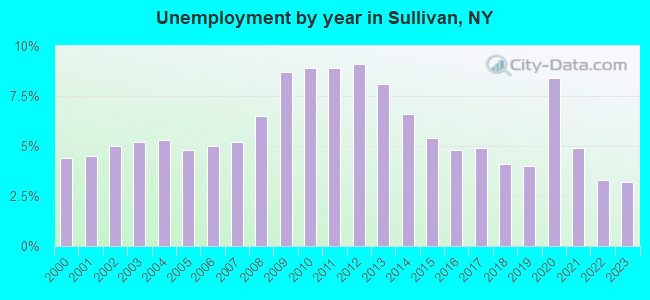
| Here: | 3.9% |
| New York: | 4.4% |

Current college students: 2,730
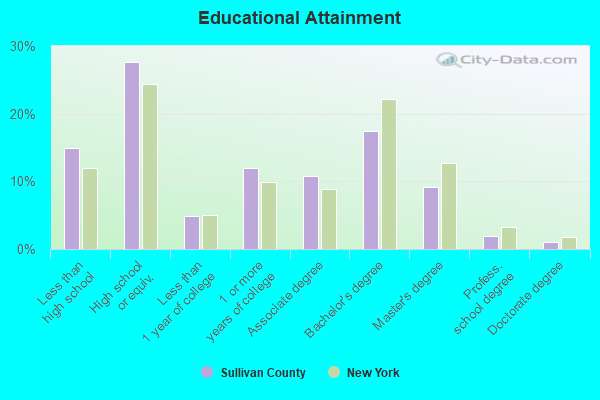
People 25 years of age or older with a high school degree or higher: 87.4%
People 25 years of age or older with a bachelor's degree or higher: 29.0%
Number of foreign born residents: 9,488 (60.8% naturalized citizens)
| Sullivan County: | 11.9% |
| Whole state: | 22.7% |
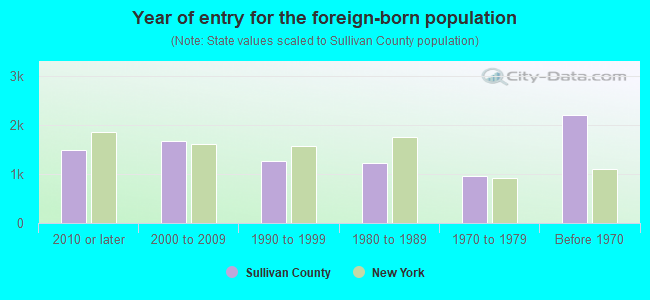
- Year of entry for the foreign-born population
- 1,9492010 or later
- 1,7162000 to 2009
- 1,5101990 to 1999
- 1,2131980 to 1989
- 9501970 to 1979
- 2,197Before 1970
Mean travel time to work (commute): minutes
Percentage of county residents living and working in this county: 97.1%
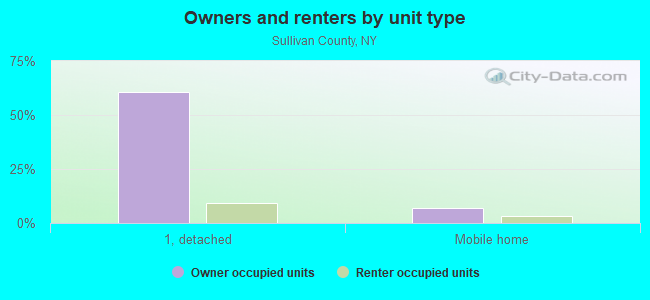
Housing units in structures:
- One, detached: 34,943
- One, attached: 2,360
- Two: 2,408
- 3 or 4: 1,828
- 5 to 9: 1,899
- 10 to 19: 1,456
- 20 to 49: 780
- 50 or more: 474
- Mobile homes: 3,808
Housing units in Sullivan County with a mortgage: 11,139 (847 second mortgage, 0 home equity loan, 695 both second mortgage and home equity loan)
Houses without a mortgage: 532
| Here: | 2.0% with mortgage |
| State: | 95.5% with mortgage |
Religion statistics for Sullivan County
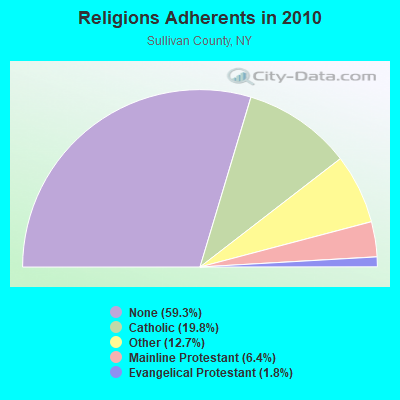
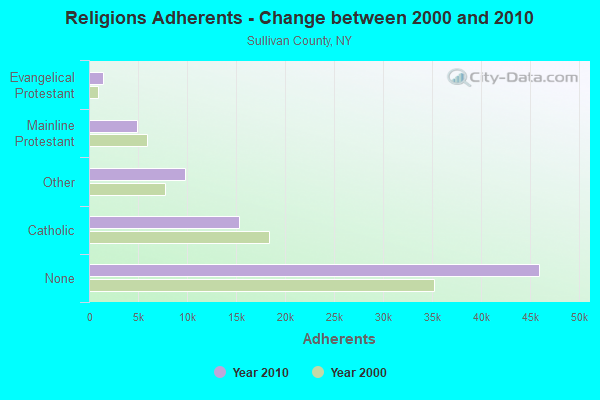
| Religion | Adherents | Congregations |
|---|---|---|
| Catholic | 15,352 | 21 |
| Other | 9,817 | 31 |
| Mainline Protestant | 4,947 | 44 |
| Evangelical Protestant | 1,399 | 18 |
| Orthodox | 60 | 2 |
| None | 45,972 | - |
Source: Clifford Grammich, Kirk Hadaway, Richard Houseal, Dale E.Jones, Alexei Krindatch, Richie Stanley and Richard H.Taylor. 2012. 2010 U.S.Religion Census: Religious Congregations & Membership Study. Association of Statisticians of American Religious Bodies. Jones, Dale E., et al. 2002. Congregations and Membership in the United States 2000. Nashville, TN: Glenmary Research Center.
Food Environment Statistics:
| Sullivan County: | 4.06 / 10,000 pop. |
| State: | 4.13 / 10,000 pop. |
| Here: | 0.13 / 10,000 pop. |
| New York: | 0.06 / 10,000 pop. |
| This county: | 2.22 / 10,000 pop. |
| New York: | 0.92 / 10,000 pop. |
| Sullivan County: | 5.63 / 10,000 pop. |
| New York: | 1.68 / 10,000 pop. |
| This county: | 10.99 / 10,000 pop. |
| State: | 8.82 / 10,000 pop. |
| Sullivan County: | 9.4% |
| New York: | 8.2% |
| Sullivan County: | 24.1% |
| State: | 23.8% |
| Here: | 16.4% |
| State: | 15.6% |
Agriculture in Sullivan County:
Average size of farms: 167 acresAverage value of agricultural products sold per farm: $99,090
Average value of crops sold per acre for harvested cropland: $101.34
The value of nursery, greenhouse, floriculture, and sod as a percentage of the total market value of agricultural products sold: 1.77%
The value of livestock, poultry, and their products as a percentage of the total market value of agricultural products sold: 92.88%
Average total farm production expenses per farm: $69,383
Harvested cropland as a percentage of land in farms: 41.72%
Irrigated harvested cropland as a percentage of land in farms: 0.43%
Average market value of all machinery and equipment per farm: $72,534
The percentage of farms operated by a family or individual: 86.09%
Average age of principal farm operators: 55 years
Average number of cattle and calves per 100 acres of all land in farms: 13.99
Milk cows as a percentage of all cattle and calves: 44.36%
Corn for grain: 370 harvested acres
Vegetables: 147 harvested acres
Land in orchards: 213 acres
Earthquake activity:
Sullivan County-area historical earthquake activity is significantly above New York state average. It is 67% smaller than the overall U.S. average.On 10/7/1983 at 10:18:46, a magnitude 5.3 (5.1 MB, 5.3 LG, 5.1 ML, Class: Moderate, Intensity: VI - VII) earthquake occurred 156.8 miles away from Sullivan County center
On 4/20/2002 at 10:50:47, a magnitude 5.3 (5.3 ML, Depth: 3.0 mi) earthquake occurred 201.3 miles away from the county center
On 8/23/2011 at 17:51:04, a magnitude 5.8 (5.8 MW, Depth: 3.7 mi) earthquake occurred 312.4 miles away from the county center
On 4/20/2002 at 10:50:47, a magnitude 5.2 (5.2 MB, 4.2 MS, 5.2 MW, 5.0 MW) earthquake occurred 199.3 miles away from the county center
On 1/16/1994 at 01:49:16, a magnitude 4.6 (4.6 MB, 4.6 LG, Depth: 3.1 mi, Class: Light, Intensity: IV - V) earthquake occurred 116.5 miles away from Sullivan County center
On 6/17/1991 at 08:53:16, a magnitude 4.1 (4.0 MB, 4.0 LG, Depth: 3.1 mi) earthquake occurred 64.1 miles away from the county center
Magnitude types: regional Lg-wave magnitude (LG), body-wave magnitude (MB), local magnitude (ML), surface-wave magnitude (MS), moment magnitude (MW)
Most recent natural disasters:
- New York Covid-19 Pandemic, Incident Period: January 20, 2020, Major Disaster (Presidential) Declared DR-4480-NY: March 20, 2020, FEMA Id: 4480, Natural disaster type: Other
- New York Severe Winter Storm And Snowstorm, Incident Period: March 14, 2017 - March 15, 2017, FEMA Id: 4322, Natural disaster type: Snowstorm, Winter Storm
- New York Hurricane Sandy, Incident Period: October 27, 2012 to November 09, 2012, Emergency Declared EM-3351: October 28, 2012, FEMA Id: 3351, Natural disaster type: Hurricane
- New York Hurricane Sandy, Incident Period: October 27, 2012 to November 09, 2012, Major Disaster (Presidential) Declared DR-4085: October 30, 2012, FEMA Id: 4085, Natural disaster type: Hurricane
- New York Remnants of Tropical Storm Lee, Incident Period: September 07, 2011 to September 11, 2011, Emergency Declared EM-3341: September 08, 2011, FEMA Id: 3341, Natural disaster type: Tropical Storm
- New York Hurricane Irene, Incident Period: August 26, 2011 to September 05, 2011, Major Disaster (Presidential) Declared DR-4020: August 31, 2011, FEMA Id: 4020, Natural disaster type: Hurricane
- New York Hurricane Irene, Incident Period: August 25, 2011 to September 05, 2011, Emergency Declared EM-3328: August 26, 2011, FEMA Id: 3328, Natural disaster type: Hurricane
- New York Severe Storms and Flooding, Incident Period: June 19, 2007, Major Disaster (Presidential) Declared DR-1710: July 02, 2007, FEMA Id: 1710, Natural disaster type: Storm, Flood
- New York Severe Storms and Flooding, Incident Period: November 16, 2006 to November 17, 2006, Major Disaster (Presidential) Declared DR-1670: December 12, 2006, FEMA Id: 1670, Natural disaster type: Storm, Flood
- New York Severe Storms and Flooding, Incident Period: June 26, 2006 to July 10, 2006, Major Disaster (Presidential) Declared DR-1650: July 01, 2006, FEMA Id: 1650, Natural disaster type: Storm, Flood
- 19 other natural disasters have been reported since 1953.
The number of natural disasters in Sullivan County (29) is a lot greater than the US average (15).
Major Disasters (Presidential) Declared: 19
Emergencies Declared: 9
Causes of natural disasters: Floods: 11, Storms: 11, Hurricanes: 5, Snowstorms: 3, Blizzards: 2, Heavy Rain: 1, Power Outage: 1, Tornado: 1, Tropical Depression: 1, Tropical Storm: 1, Water Shortage: 1, Winter Storm: 1, Other: 3 (Note: some incidents may be assigned to more than one category).
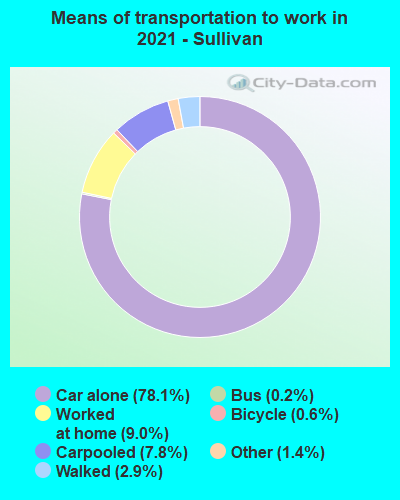
Means of transportation to work:
- Drove a car alone: 20,492 (71.1%)
- Carpooled: 3,075 (10.7%)
- Bus: 26 (0.1%)
- Subway or elevated rail: 2 (0.0%)
- Taxicab, motorcycle, or other means: 383 (1.3%)
- Bicycle: 191 (0.7%)
- Walked: 982 (3.4%)
- Worked at home: 4,071 (14.1%)

- Health care and social assistance (22%)
- Educational services (16%)
- Retail trade (9%)
- Public administration (5%)
- Professional, scientific, and technical services (5%)
- Accommodation and food services (4%)
- Other services, except public administration (3%)
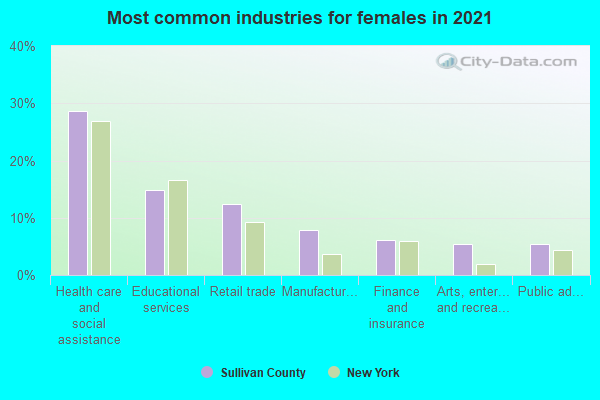
- Health care and social assistance (27%)
- Educational services (20%)
- Retail trade (11%)
- Public administration (6%)
- Professional, scientific, and technical services (6%)
- Accommodation and food services (6%)
- Other services, except public administration (3%)
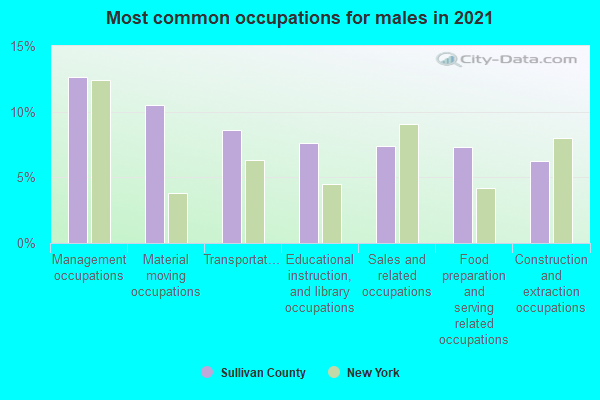
- Construction and extraction occupations (12%)
- Management occupations (11%)
- Sales and related occupations (9%)
- Food preparation and serving related occupations (7%)
- Installation, maintenance, and repair occupations (6%)
- Building and grounds cleaning and maintenance occupations (6%)
- Office and administrative support occupations (6%)
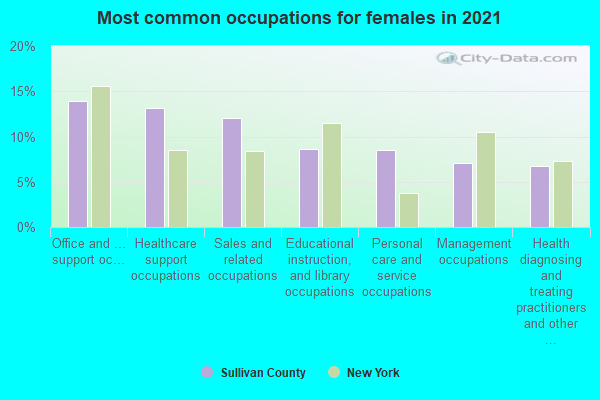
- Office and administrative support occupations (18%)
- Educational instruction, and library occupations (13%)
- Management occupations (11%)
- Healthcare support occupations (10%)
- Sales and related occupations (10%)
- Food preparation and serving related occupations (6%)
- Health diagnosing and treating practitioners and other technical occupations (4%)
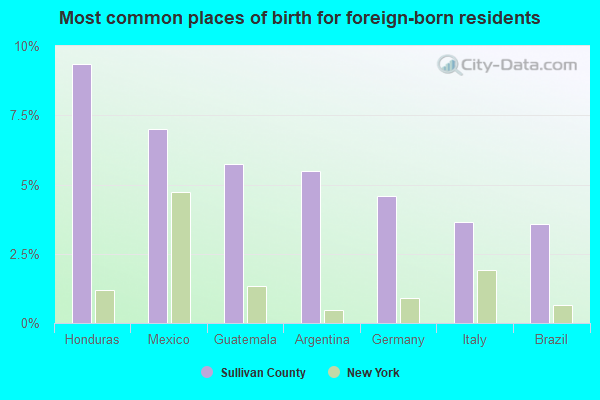
- Guatemala (7%)
- Mexico (7%)
- Honduras (6%)
- Germany (5%)
- Argentina (5%)
- Brazil (4%)
- El Salvador (4%)
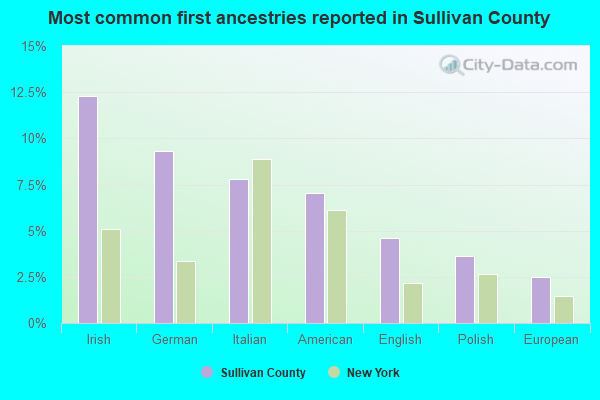
- Irish (12%)
- German (8%)
- American (8%)
- Italian (8%)
- English (4%)
- Polish (3%)
- European (3%)
People in group quarters in Sullivan County, New York in 2010:
- 1,276 people in state prisons
- 513 people in workers' group living quarters and job corps centers
- 484 people in residential treatment centers for adults
- 381 people in group homes intended for adults
- 368 people in nursing facilities/skilled-nursing facilities
- 268 people in other noninstitutional facilities
- 147 people in local jails and other municipal confinement facilities
- 139 people in emergency and transitional shelters (with sleeping facilities) for people experiencing homelessness
- 120 people in group homes for juveniles (non-correctional)
- 76 people in residential treatment centers for juveniles (non-correctional)
- 31 people in college/university student housing
- 22 people in correctional residential facilities
People in group quarters in Sullivan County, New York in 2000:
- 1,769 people in state prisons
- 396 people in other noninstitutional group quarters
- 394 people in nursing homes
- 374 people in job corps and vocational training facilities
- 364 people in homes or halfway houses for drug/alcohol abuse
- 329 people in other nonhousehold living situations
- 270 people in homes for the mentally retarded
- 199 people in hospitals or wards for drug/alcohol abuse
- 184 people in orthopedic wards and institutions for the physically handicapped
- 172 people in college dormitories (includes college quarters off campus)
- 160 people in local jails and other confinement facilities (including police lockups)
- 107 people in agriculture workers' dormitories on farms
- 64 people in other group homes
- 17 people in homes for the mentally ill
- 14 people in religious group quarters
- 12 people in schools, hospitals, or wards for the intellectually disabled
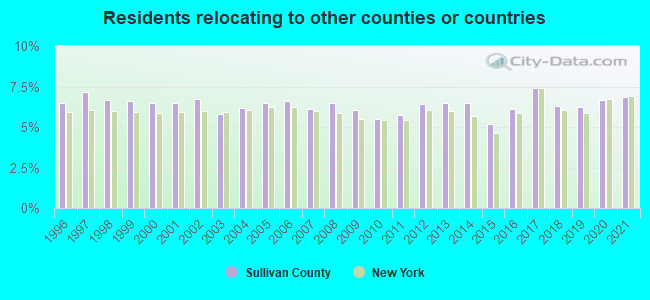
8.18% of this county's 2021 resident taxpayers lived in other counties in 2020 ($98,332 average adjusted gross income)
| Here: | 8.18% |
| New York average: | 5.29% |
10 or fewer of this county's residents moved from foreign countries.
6.23% relocated from other counties in New York ($79,636 average AGI)
1.95% relocated from other states ($18,697 average AGI)
Sullivan County: 1.95% New York average: 1.86%

Top counties from which taxpayers relocated into this county between 2020 and 2021:
| from Orange County, NY | |
| from Kings County, NY | |
| from New York County, NY | |
| from Queens County, NY | |
| from Ulster County, NY | |
| from Bronx County, NY | |
| from Rockland County, NY |
6.88% of this county's 2020 resident taxpayers moved to other counties in 2021 ($71,243 average adjusted gross income)
| Here: | 6.88% |
| New York average: | 6.93% |
10 or fewer of this county's residents moved to foreign countries.
3.58% relocated to other counties in New York ($37,636 average AGI)
3.30% relocated to other states ($33,607 average AGI)
Sullivan County: 3.30% New York average: 3.55%
Top counties to which taxpayers relocated from this county between 2020 and 2021:
| to Orange County, NY | |
| to Ulster County, NY | |
| to Kings County, NY | |
| to New York County, NY | |
| to Pike County, PA | |
| to Queens County, NY | |
| to Westchester County, NY |
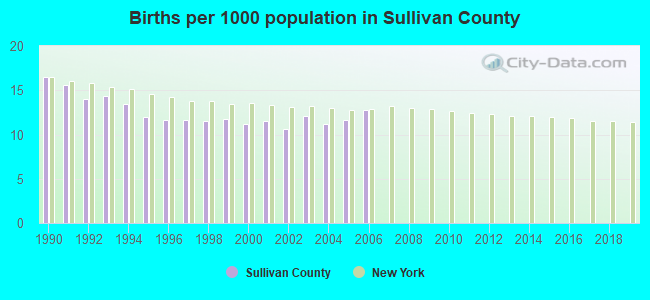
Births per 1000 population from 1990 to 1999: 13.2
Births per 1000 population from 2000 to 2006: 11.6
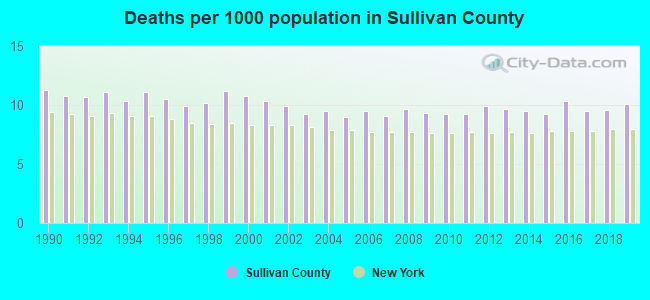
Deaths per 1000 population from 1990 to 1999: 10.7
Deaths per 1000 population from 2000 to 2009: 9.6
Deaths per 1000 population from 2010 to 2020: 9.8
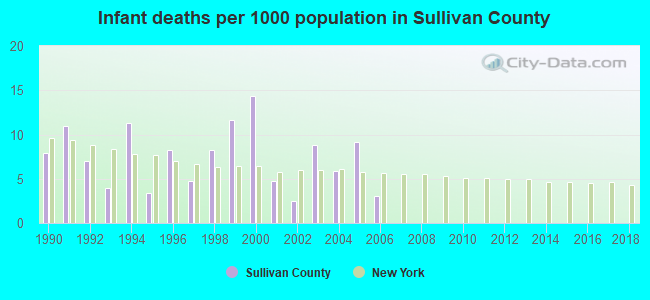
Infant deaths per 1000 live births from 1990 to 1999: 7.8
Infant deaths per 1000 live births from 2000 to 2006: 6.9
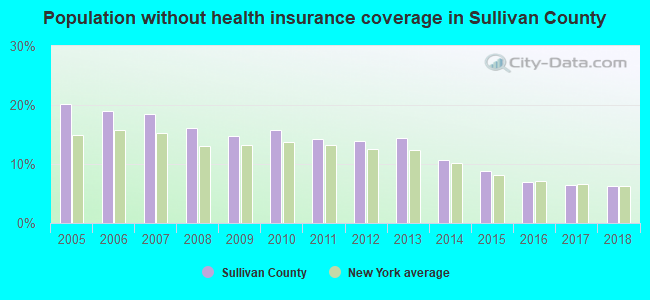
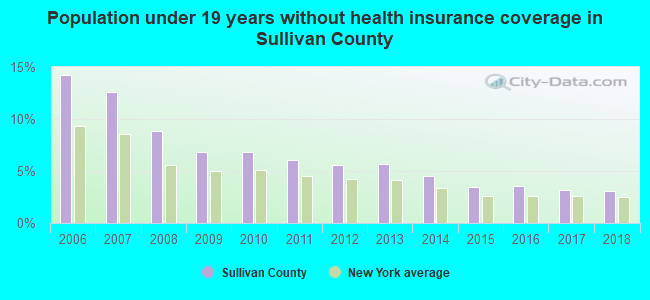
Persons under 19 years old without health insurance coverage in 2018: 3.1%
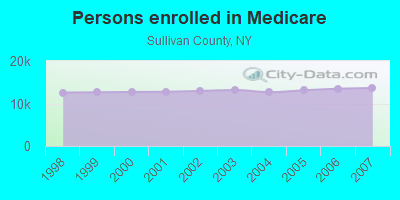
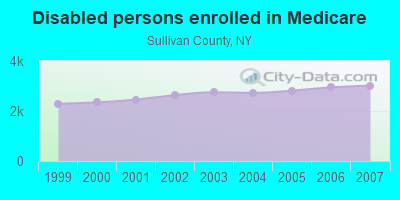
Persons enrolled in hospital insurance and/or supplemental medical insurance (Medicare) in July 1, 2007: 13,647 (10,632 aged, 3,015 disabled)
Children under 18 without health insurance coverage in 2007: 1,895 (11%)

Most common underlying causes of death in Sullivan County, New York in 1999 - 2019:
- Atherosclerotic heart disease (1,755)
- Bronchus or lung, unspecified - Malignant neoplasms (1,089)
- Acute myocardial infarction, unspecified (909)
- Chronic obstructive pulmonary disease, unspecified (691)
- Septicaemia, unspecified (324)
- Unspecified diabetes mellitus, without complications (316)
- Pneumonia, unspecified (287)
- Stroke, not specified as haemorrhage or infarction (274)
- Congestive heart failure (250)
- Other disorders of electrolyte and fluid balance, not elsewhere classified (236)
Population without health insurance coverage in 2000: 15%
Children under 18 without health insurance coverage in 2000: 10%
Short term general hospital admissions per 100,000 population in 2004: 7,780
Short term general hospital beds per 100,000 population in 2004: 360
Emergency room visits per 100,000 population in 2004: 37,824
General practice office based MDs per 100,000 population in 2005: 1,155
Medical specialist MDs per 100,000 population in 2005: 932
Dentists per 100,000 population in 1998: 17
Total births per 100,000 population, July 2005 - July 2006 : 35
Total deaths per 100,000 population, July 2005 - July 2006: 78
Limited-service eating places per 100,000 population in 2005 : 18
EPA green book nonattainment status in 2004-2006: 1
Suicides per 1,000,000 population from 2000 to 2006: 114.6. This is more than state average.
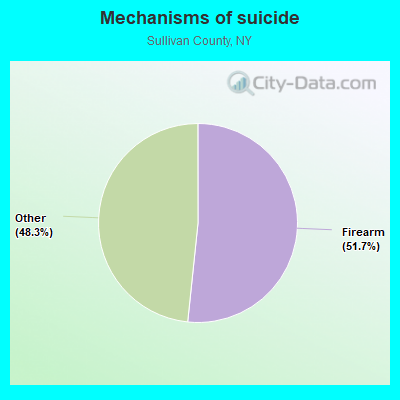
- Firearm - 59.2
- Other - 55.4
Household type by relationship:
Households: 79,658- Male householders: 16,411 (5,931 living alone), Female householders: 16,347 (4,983 living alone)
12,991 spouses (12,800 opposite-sex spouses), 3,816 unmarried partners, (3,664 opposite-sex unmarried partners), 20,880 children (19,868 natural, 118 adopted, 894 stepchildren), 1,367 grandchildren, 383 brothers or sisters, 765 parents, 13 foster children, 930 other relatives, 1,170 non-relatives
- In group quarters: 4,585
Size of family households: 8,809 2-persons, 4,173 3-persons, 3,812 4-persons, 1,651 5-persons, 449 6-persons, 718 7-or-more-persons.
Size of nonfamily households: 10,914 1-person, 2,095 2-persons, 114 3-persons, 23 4-persons.
9,002 married couples with children.
5,684 single-parent households (1,894 men, 3,790 women).
80.6% of residents of Sullivan speak English at home.
10.5% of residents speak Spanish at home (62% speak English very well, 21% speak English well, 13% speak English not well, 4% don't speak English at all).
6.7% of residents speak other Indo-European language at home (59% speak English very well, 26% speak English well, 10% speak English not well, 6% don't speak English at all).
1.2% of residents speak Asian or Pacific Island language at home (61% speak English very well, 25% speak English well, 13% speak English not well, 1% don't speak English at all).
1.0% of residents speak other language at home (82% speak English very well, 10% speak English well, 7% speak English not well).
In fiscal year 2004:
Federal Government expenditure: $519,833,000 ($6,830 per capita)
Department of Defense expenditure: $3,791,000
Federal direct payments to individuals for retirement and disability: $194,747,000
Federal other direct payments to individuals: $112,831,000
Federal direct payments not to individuals: $764,000
Federal grants: $189,046,000
Federal procurement contracts: $7,634,000 ($532,000 Department of Defense)
Federal salaries and wages: $14,811,000 ($0,000 Department of Defense)
Federal Government direct loans: $369,000
Federal guaranteed/insured loans: $12,803,000
Federal Government insurance: $53,158,000
Population change from April 1, 2000 to July 1, 2005:
Births: 4,545| Here: | 59 per 1000 residents |
| State: | 70 per 1000 residents |
Deaths: 3,781
| Here: | 49 per 1000 residents |
| State: | 42 per 1000 residents |
Net international migration: +681
| Here: | +9 per 1000 residents |
| State: | +35 per 1000 residents |
Net internal migration: +1,240
| Here: | |
| State: |
Total withdrawal of fresh water for public supply: 138.05 millions of gallons per day (4% from ground, 96% from surface)
| Here: | 6.1 |
| State: | 6.3 |
| Here: | 4.0 |
| State: | 3.8 |
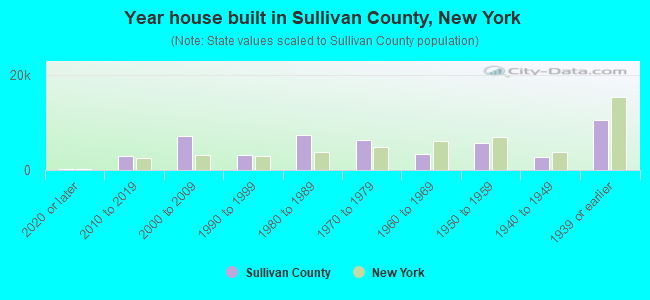
- Year house built in Sullivan County, New York
- 1522020 or later
- 4,0152010 to 2019
- 4,7522000 to 2009
- 3,6831990 to 1999
- 7,7731980 to 1989
- 5,3991970 to 1979
- 4,3061960 to 1969
- 3,9191950 to 1959
- 4,7901940 to 1949
- 11,1671939 or earlier
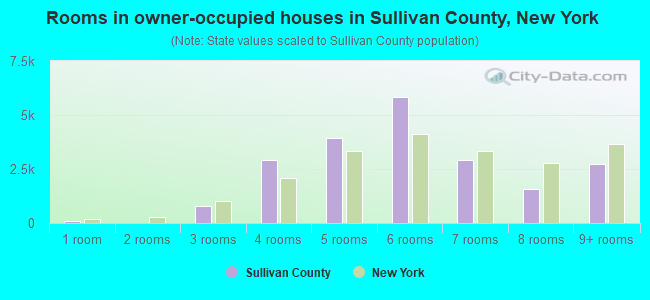
- Rooms in owner-occupied houses in Sullivan County, New York
- 01 room
- 1272 rooms
- 1,2493 rooms
- 1,9374 rooms
- 4,9795 rooms
- 4,5246 rooms
- 3,3527 rooms
- 2,7498 rooms
- 2,8609+ rooms
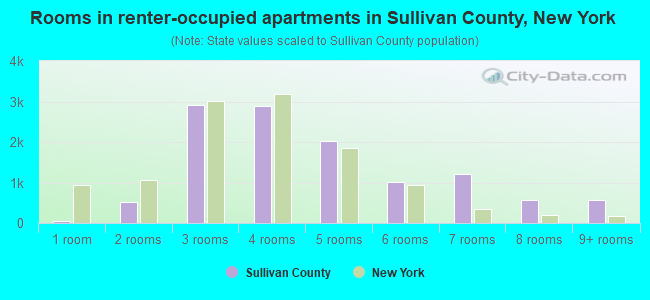
- Rooms in renter-occupied apartments in Sullivan County, New York
- 8101 room
- 1,0042 rooms
- 2,5503 rooms
- 2,2684 rooms
- 2,3255 rooms
- 1,0156 rooms
- 5127 rooms
- 678 rooms
- 4309+ rooms
- Bedrooms in owner-occupied houses in Sullivan County, New York
- 0no bedroom
- 4791 bedroom
- 6,2302 bedrooms
- 8,8723 bedrooms
- 4,5924 bedrooms
- 1,6045+ bedrooms
- Bedrooms in renter-occupied apartments in Sullivan County, New York
- 810no bedroom
- 3,4481 bedroom
- 3,3022 bedrooms
- 2,7503 bedrooms
- 2704 bedrooms
- 4015+ bedrooms
- Cars and other vehicles available in Sullivan County in owner-occupied houses/condos
- 892no vehicle
- 8,0331 vehicle
- 8,3742 vehicles
- 2,8373 vehicles
- 1,1934 vehicles
- 4485+ vehicles
- Cars and other vehicles available in Sullivan County in renter-occupied apartments
- 2,344no vehicle
- 4,9841 vehicle
- 2,6382 vehicles
- 6213 vehicles
- 1564 vehicles
- 2385+ vehicles
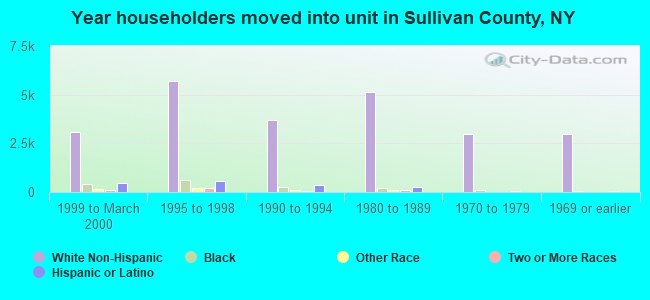
91.3% of Sullivan County residents lived in the same house 1 years ago.
Out of people who lived in different houses, 32% lived in this county.
Out of people who lived in different counties, 80% lived in New York.
| Sullivan County: | 91.3% |
| State average: | 89.6% |
Place of birth for U.S.-born residents:
- This state: 57,687
- Other state: 10,436
- Northeast: 5,023
- Midwest: 1,760
- South: 2,625
- West: 1,028
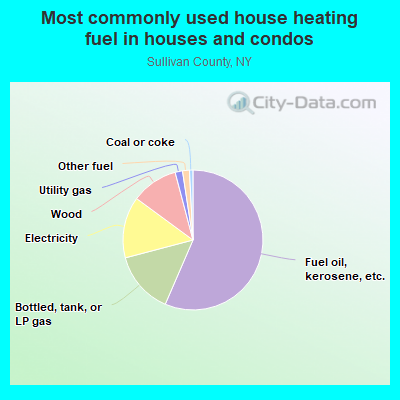
- 50.6%Fuel oil, kerosene, etc.
- 21.8%Bottled, tank, or LP gas
- 11.1%Electricity
- 10.9%Wood
- 4.0%Utility gas
- 1.1%Other fuel
- 0.4%Coal or coke
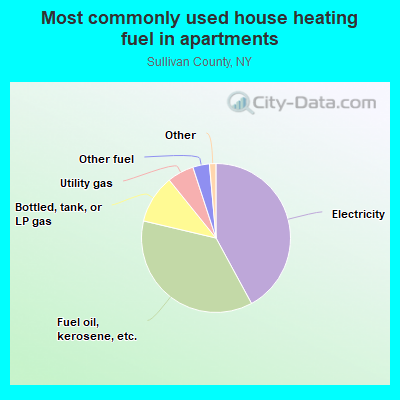
- 36.7%Fuel oil, kerosene, etc.
- 31.5%Electricity
- 16.5%Bottled, tank, or LP gas
- 8.5%Utility gas
- 3.8%Wood
- 1.7%Other fuel
- 1.1%No fuel used
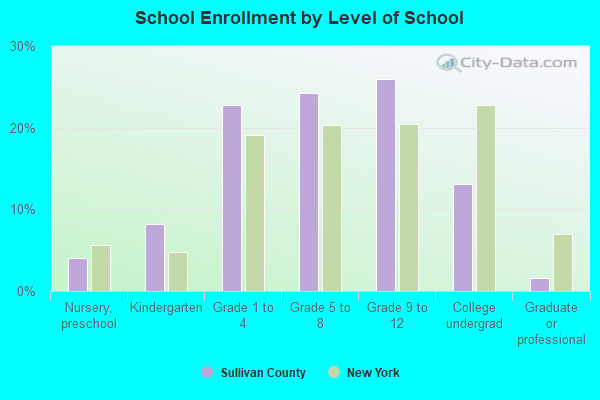
Private vs. public school enrollment:
| Here: | 19.9% |
| New York: | 15.6% |
| Here: | 13.8% |
| New York: | 15.0% |
| Here: | 33.7% |
| New York: | 39.2% |
Sullivan County government finances - Expenditure in 2017:
- Assistance and Subsidies - Public Welfare, Federal Categorical Assistance Programs: $8,895,000
- Bond Funds - Cash and Securities: $5,459,000
Cash and Securities: $4,692,000
- Charges - Hospital Public: $3,184,000
Hospital Public: $2,884,000
Sewerage: $76,000
Sewerage: $69,000
Parks and Recreation: $11,000
Parks and Recreation: $10,000
- Current Operations - Hospitals: $71,166,000
Hospitals: $62,092,000
Public Welfare - Other: $10,195,000
Central Staff Services: $5,770,000
Regular Highways: $5,160,000
Central Staff Services: $5,034,000
Regular Highways: $4,502,000
General - Other: $4,208,000
Health - Other: $3,986,000
Police Protection: $3,948,000
General - Other: $3,672,000
Health - Other: $3,477,000
Police Protection: $3,445,000
Judicial and Legal Services: $1,924,000
Judicial and Legal Services: $1,678,000
General Public Buildings: $791,000
General Public Buildings: $691,000
Housing and Community Development: $527,000
Housing and Community Development: $460,000
Sewerage: $64,000
Sewerage: $55,000
Parks and Recreation: $9,000
Parks and Recreation: $8,000
- Federal Intergovernmental - Sewerage: $1,594,000
Sewerage: $1,594,000
Air Transportation: $42,000
Air Transportation: $42,000
- General - Interest on Debt: $670,000
Interest on Debt: $26,000
- Local Intergovernmental - Health and Hospitals: $185,000
Health and Hospitals: $185,000
- Long Term Debt - Outstanding Unspecified Public Purpose: $15,923,000
Beginning Outstanding - Unspecified Public Purpose: $13,902,000
Outstanding Unspecified Public Purpose: $11,881,000
Beginning Outstanding - Unspecified Public Purpose: $11,232,000
Issue, Unspecified Public Purpose: $6,713,000
Retired Unspecified Public Purpose: $2,021,000
Retired Unspecified Public Purpose: $2,021,000
Beginning Outstanding - Public Debt for Private Purpose: $193,000
Outstanding Nonguaranteed - Industrial Revenue: $177,000
Beginning Outstanding - Public Debt for Private Purpose: $161,000
Outstanding Nonguaranteed - Industrial Revenue: $145,000
Retired Nonguaranteed - Public Debt for Private Purpose: $16,000
Retired Nonguaranteed - Public Debt for Private Purpose: $16,000
- Miscellaneous - General Revenue - Other: $10,009,000
Fines and Forfeits: $9,798,000
General Revenue - Other: $5,079,000
Fines and Forfeits: $4,972,000
Rents: $728,000
Rents: $369,000
Interest Earnings: $277,000
Interest Earnings: $140,000
Sale of Property: $88,000
Sale of Property: $45,000
Donations From Private Sources: $8,000
Donations From Private Sources: $4,000
- Other Funds - Cash and Securities: $27,097,000
Cash and Securities: $23,290,000
- Sinking Funds - Cash and Securities: $206,000
Cash and Securities: $177,000
- State Intergovernmental - Public Welfare: $9,062,000
Public Welfare: $7,127,000
Highways: $3,340,000
Highways: $2,627,000
Housing and Community Development: $408,000
Housing and Community Development: $321,000
Health and Hospitals: $313,000
Health and Hospitals: $246,000
Other: $236,000
Other: $186,000
- Tax - Property: $8,862,000
Property: $7,821,000
General Sales and Gross Receipts: $4,467,000
General Sales and Gross Receipts: $3,942,000
Motor Vehicle License: $2,263,000
Motor Vehicle License: $1,997,000
Public Utilities Sales: $430,000
Public Utilities Sales: $380,000
Occupation and Business License - Other: $2,000
Occupation and Business License - Other: $2,000
- Total Salaries and Wages: $1,202,045,000
: $107,736,000
Sullivan County government finances - Revenue in 2017:
- Assistance and Subsidies - Public Welfare, Federal Categorical Assistance Programs: $8,895,000
- Bond Funds - Cash and Securities: $5,459,000
Cash and Securities: $4,692,000
- Charges - Hospital Public: $3,184,000
Hospital Public: $2,884,000
Sewerage: $76,000
Sewerage: $69,000
Parks and Recreation: $11,000
Parks and Recreation: $10,000
- Current Operations - Hospitals: $71,166,000
Hospitals: $62,092,000
Public Welfare - Other: $10,195,000
Central Staff Services: $5,770,000
Regular Highways: $5,160,000
Central Staff Services: $5,034,000
Regular Highways: $4,502,000
General - Other: $4,208,000
Health - Other: $3,986,000
Police Protection: $3,948,000
General - Other: $3,672,000
Health - Other: $3,477,000
Police Protection: $3,445,000
Judicial and Legal Services: $1,924,000
Judicial and Legal Services: $1,678,000
General Public Buildings: $791,000
General Public Buildings: $691,000
Housing and Community Development: $527,000
Housing and Community Development: $460,000
Sewerage: $64,000
Sewerage: $55,000
Parks and Recreation: $9,000
Parks and Recreation: $8,000
- Federal Intergovernmental - Sewerage: $1,594,000
Sewerage: $1,594,000
Air Transportation: $42,000
Air Transportation: $42,000
- General - Interest on Debt: $670,000
Interest on Debt: $26,000
- Local Intergovernmental - Health and Hospitals: $185,000
Health and Hospitals: $185,000
- Long Term Debt - Outstanding Unspecified Public Purpose: $15,923,000
Beginning Outstanding - Unspecified Public Purpose: $13,902,000
Outstanding Unspecified Public Purpose: $11,881,000
Beginning Outstanding - Unspecified Public Purpose: $11,232,000
Issue, Unspecified Public Purpose: $6,713,000
Retired Unspecified Public Purpose: $2,021,000
Retired Unspecified Public Purpose: $2,021,000
Beginning Outstanding - Public Debt for Private Purpose: $193,000
Outstanding Nonguaranteed - Industrial Revenue: $177,000
Beginning Outstanding - Public Debt for Private Purpose: $161,000
Outstanding Nonguaranteed - Industrial Revenue: $145,000
Retired Nonguaranteed - Public Debt for Private Purpose: $16,000
Retired Nonguaranteed - Public Debt for Private Purpose: $16,000
- Miscellaneous - General Revenue - Other: $10,009,000
Fines and Forfeits: $9,798,000
General Revenue - Other: $5,079,000
Fines and Forfeits: $4,972,000
Rents: $728,000
Rents: $369,000
Interest Earnings: $277,000
Interest Earnings: $140,000
Sale of Property: $88,000
Sale of Property: $45,000
Donations From Private Sources: $8,000
Donations From Private Sources: $4,000
- Other Funds - Cash and Securities: $27,097,000
Cash and Securities: $23,290,000
- Sinking Funds - Cash and Securities: $206,000
Cash and Securities: $177,000
- State Intergovernmental - Public Welfare: $9,062,000
Public Welfare: $7,127,000
Highways: $3,340,000
Highways: $2,627,000
Housing and Community Development: $408,000
Housing and Community Development: $321,000
Health and Hospitals: $313,000
Health and Hospitals: $246,000
Other: $236,000
Other: $186,000
- Tax - Property: $8,862,000
Property: $7,821,000
General Sales and Gross Receipts: $4,467,000
General Sales and Gross Receipts: $3,942,000
Motor Vehicle License: $2,263,000
Motor Vehicle License: $1,997,000
Public Utilities Sales: $430,000
Public Utilities Sales: $380,000
Occupation and Business License - Other: $2,000
Occupation and Business License - Other: $2,000
- Total Salaries and Wages: $1,202,045,000
: $107,736,000
Sullivan County government finances - Debt in 2017:
- Assistance and Subsidies - Public Welfare, Federal Categorical Assistance Programs: $8,895,000
- Bond Funds - Cash and Securities: $5,459,000
Cash and Securities: $4,692,000
- Charges - Hospital Public: $3,184,000
Hospital Public: $2,884,000
Sewerage: $76,000
Sewerage: $69,000
Parks and Recreation: $11,000
Parks and Recreation: $10,000
- Current Operations - Hospitals: $71,166,000
Hospitals: $62,092,000
Public Welfare - Other: $10,195,000
Central Staff Services: $5,770,000
Regular Highways: $5,160,000
Central Staff Services: $5,034,000
Regular Highways: $4,502,000
General - Other: $4,208,000
Health - Other: $3,986,000
Police Protection: $3,948,000
General - Other: $3,672,000
Health - Other: $3,477,000
Police Protection: $3,445,000
Judicial and Legal Services: $1,924,000
Judicial and Legal Services: $1,678,000
General Public Buildings: $791,000
General Public Buildings: $691,000
Housing and Community Development: $527,000
Housing and Community Development: $460,000
Sewerage: $64,000
Sewerage: $55,000
Parks and Recreation: $9,000
Parks and Recreation: $8,000
- Federal Intergovernmental - Sewerage: $1,594,000
Sewerage: $1,594,000
Air Transportation: $42,000
Air Transportation: $42,000
- General - Interest on Debt: $670,000
Interest on Debt: $26,000
- Local Intergovernmental - Health and Hospitals: $185,000
Health and Hospitals: $185,000
- Long Term Debt - Outstanding Unspecified Public Purpose: $15,923,000
Beginning Outstanding - Unspecified Public Purpose: $13,902,000
Outstanding Unspecified Public Purpose: $11,881,000
Beginning Outstanding - Unspecified Public Purpose: $11,232,000
Issue, Unspecified Public Purpose: $6,713,000
Retired Unspecified Public Purpose: $2,021,000
Retired Unspecified Public Purpose: $2,021,000
Beginning Outstanding - Public Debt for Private Purpose: $193,000
Outstanding Nonguaranteed - Industrial Revenue: $177,000
Beginning Outstanding - Public Debt for Private Purpose: $161,000
Outstanding Nonguaranteed - Industrial Revenue: $145,000
Retired Nonguaranteed - Public Debt for Private Purpose: $16,000
Retired Nonguaranteed - Public Debt for Private Purpose: $16,000
- Miscellaneous - General Revenue - Other: $10,009,000
Fines and Forfeits: $9,798,000
General Revenue - Other: $5,079,000
Fines and Forfeits: $4,972,000
Rents: $728,000
Rents: $369,000
Interest Earnings: $277,000
Interest Earnings: $140,000
Sale of Property: $88,000
Sale of Property: $45,000
Donations From Private Sources: $8,000
Donations From Private Sources: $4,000
- Other Funds - Cash and Securities: $27,097,000
Cash and Securities: $23,290,000
- Sinking Funds - Cash and Securities: $206,000
Cash and Securities: $177,000
- State Intergovernmental - Public Welfare: $9,062,000
Public Welfare: $7,127,000
Highways: $3,340,000
Highways: $2,627,000
Housing and Community Development: $408,000
Housing and Community Development: $321,000
Health and Hospitals: $313,000
Health and Hospitals: $246,000
Other: $236,000
Other: $186,000
- Tax - Property: $8,862,000
Property: $7,821,000
General Sales and Gross Receipts: $4,467,000
General Sales and Gross Receipts: $3,942,000
Motor Vehicle License: $2,263,000
Motor Vehicle License: $1,997,000
Public Utilities Sales: $430,000
Public Utilities Sales: $380,000
Occupation and Business License - Other: $2,000
Occupation and Business License - Other: $2,000
- Total Salaries and Wages: $1,202,045,000
: $107,736,000
Sullivan County government finances - Cash and Securities in 2017:
- Assistance and Subsidies - Public Welfare, Federal Categorical Assistance Programs: $8,895,000
- Bond Funds - Cash and Securities: $5,459,000
Cash and Securities: $4,692,000
- Charges - Hospital Public: $3,184,000
Hospital Public: $2,884,000
Sewerage: $76,000
Sewerage: $69,000
Parks and Recreation: $11,000
Parks and Recreation: $10,000
- Current Operations - Hospitals: $71,166,000
Hospitals: $62,092,000
Public Welfare - Other: $10,195,000
Central Staff Services: $5,770,000
Regular Highways: $5,160,000
Central Staff Services: $5,034,000
Regular Highways: $4,502,000
General - Other: $4,208,000
Health - Other: $3,986,000
Police Protection: $3,948,000
General - Other: $3,672,000
Health - Other: $3,477,000
Police Protection: $3,445,000
Judicial and Legal Services: $1,924,000
Judicial and Legal Services: $1,678,000
General Public Buildings: $791,000
General Public Buildings: $691,000
Housing and Community Development: $527,000
Housing and Community Development: $460,000
Sewerage: $64,000
Sewerage: $55,000
Parks and Recreation: $9,000
Parks and Recreation: $8,000
- Federal Intergovernmental - Sewerage: $1,594,000
Sewerage: $1,594,000
Air Transportation: $42,000
Air Transportation: $42,000
- General - Interest on Debt: $670,000
Interest on Debt: $26,000
- Local Intergovernmental - Health and Hospitals: $185,000
Health and Hospitals: $185,000
- Long Term Debt - Outstanding Unspecified Public Purpose: $15,923,000
Beginning Outstanding - Unspecified Public Purpose: $13,902,000
Outstanding Unspecified Public Purpose: $11,881,000
Beginning Outstanding - Unspecified Public Purpose: $11,232,000
Issue, Unspecified Public Purpose: $6,713,000
Retired Unspecified Public Purpose: $2,021,000
Retired Unspecified Public Purpose: $2,021,000
Beginning Outstanding - Public Debt for Private Purpose: $193,000
Outstanding Nonguaranteed - Industrial Revenue: $177,000
Beginning Outstanding - Public Debt for Private Purpose: $161,000
Outstanding Nonguaranteed - Industrial Revenue: $145,000
Retired Nonguaranteed - Public Debt for Private Purpose: $16,000
Retired Nonguaranteed - Public Debt for Private Purpose: $16,000
- Miscellaneous - General Revenue - Other: $10,009,000
Fines and Forfeits: $9,798,000
General Revenue - Other: $5,079,000
Fines and Forfeits: $4,972,000
Rents: $728,000
Rents: $369,000
Interest Earnings: $277,000
Interest Earnings: $140,000
Sale of Property: $88,000
Sale of Property: $45,000
Donations From Private Sources: $8,000
Donations From Private Sources: $4,000
- Other Funds - Cash and Securities: $27,097,000
Cash and Securities: $23,290,000
- Sinking Funds - Cash and Securities: $206,000
Cash and Securities: $177,000
- State Intergovernmental - Public Welfare: $9,062,000
Public Welfare: $7,127,000
Highways: $3,340,000
Highways: $2,627,000
Housing and Community Development: $408,000
Housing and Community Development: $321,000
Health and Hospitals: $313,000
Health and Hospitals: $246,000
Other: $236,000
Other: $186,000
- Tax - Property: $8,862,000
Property: $7,821,000
General Sales and Gross Receipts: $4,467,000
General Sales and Gross Receipts: $3,942,000
Motor Vehicle License: $2,263,000
Motor Vehicle License: $1,997,000
Public Utilities Sales: $430,000
Public Utilities Sales: $380,000
Occupation and Business License - Other: $2,000
Occupation and Business License - Other: $2,000
- Total Salaries and Wages: $1,202,045,000
: $107,736,000
Supplemental Security Income (SSI) in 2006:
- Total number of recipients: 2,776
- Number of aged recipients: 276
- Number of blind and disabled recipients: 2,500
- Number of recipients under 18: 369
- Number of recipients between 18 and 64: 1,853
- Number of recipients older than 64: 554
- Number of recipients also receiving OASDI: 1,159
- Amount of payments (thousands of dollars): 1,290
| Most common first names in Sullivan County, NY among deceased individuals | ||
| Name | Count | Lived (average) |
|---|---|---|
| John | 535 | 73.6 years |
| William | 526 | 73.6 years |
| Mary | 482 | 79.6 years |
| Joseph | 443 | 73.7 years |
| Charles | 337 | 74.6 years |
| George | 319 | 75.7 years |
| Anna | 297 | 82.5 years |
| James | 290 | 72.5 years |
| Robert | 284 | 69.2 years |
| Frank | 271 | 76.6 years |
| Most common last names in Sullivan County, NY among deceased individuals | ||
| Last name | Count | Lived (average) |
|---|---|---|
| Smith | 172 | 76.8 years |
| Miller | 95 | 76.9 years |
| Brown | 94 | 72.8 years |
| Davis | 76 | 72.7 years |
| Johnson | 75 | 73.1 years |
| Williams | 63 | 70.3 years |
| Cohen | 59 | 78.3 years |
| Edwards | 54 | 75.8 years |
| Jones | 49 | 69.6 years |
| Decker | 47 | 78.0 years |
| Businesses in Sullivan County, NY | ||||
| Name | Count | Name | Count | |
|---|---|---|---|---|
| ALDI | 1 | La-Z-Boy | 1 | |
| AT&T | 1 | MasterBrand Cabinets | 4 | |
| Ace Hardware | 3 | McDonald's | 3 | |
| Advance Auto Parts | 2 | Nike | 1 | |
| AutoZone | 1 | Penske | 1 | |
| Best Western | 1 | Pizza Hut | 2 | |
| Blockbuster | 1 | RadioShack | 1 | |
| Burger King | 2 | Rite Aid | 2 | |
| Chevrolet | 2 | Sears | 1 | |
| Curves | 2 | Sprint Nextel | 1 | |
| Days Inn | 2 | Staples | 1 | |
| Dunkin Donuts | 2 | Subway | 2 | |
| Econo Lodge | 1 | Super 8 | 1 | |
| FedEx | 4 | T-Mobile | 1 | |
| Ford | 3 | Taco Bell | 1 | |
| GNC | 1 | Toyota | 1 | |
| H&R Block | 2 | True Value | 2 | |
| Home Depot | 1 | U-Haul | 9 | |
| Howard Johnson | 1 | UPS | 13 | |
| Hyundai | 1 | Walmart | 1 | |
| KFC | 1 | Wendy's | 2 | |
Sullivan County on our top lists:
- #42 on the list of "Top 101 counties with the highest surface withdrawal of fresh water for public supply (pop. 50,000+)"
- #43 on the list of "Top 101 counties with the highest surface withdrawal of fresh water for public supply"
- #47 on the list of "Top 101 counties with the smallest number of children under 18 without health insurance coverage in 2000 (pop. 50,000+)"
- #60 on the list of "Top 101 counties with the highest total withdrawal of fresh water for public supply (pop. 50,000+)"
- #61 on the list of "Top 101 counties with the highest total withdrawal of fresh water for public supply"
- #72 on the list of "Top 101 counties with the largest number of people moving out compared to moving in (pop. 50,000+)"
- #101 on the list of "Top 101 counties with the smallest number of people without health insurance coverage in 2000 (pop. 50,000+)"