Races in Balch Springs, Texas (TX) Detailed Stats
Data:
Races - White alone (%)
Races - White alone (% change since 2000)
Races - Black alone (%)
Races - Black alone (% change since 2000)
Races - American Indian alone (%)
Races - American Indian alone (% change since 2000)
Races - Asian alone (%)
Races - Asian alone (% change since 2000)
Races - Hispanic (%)
Races - Hispanic (% change since 2000)
Races - Native Hawaiian and Other Pacific Islander alone (%)
Races - Native Hawaiian and Other Pacific Islander alone (% change since 2000)
Races - Two or more races(%)
Races - Two or more races(% change since 2000)
Races - Other race alone (%)
Races - Other race alone (% change since 2000)
Racial diversity
Place of birth - Born in state of residence (%)
Place of birth - Born in state of residence (%) - White
Place of birth - Born in state of residence (%) - Black or African American
Place of birth - Born in state of residence (%) - Asian
Place of birth - Born in state of residence (%) - Hispanic or Latino
Place of birth - Born in state of residence (%) - American Indian and Alaska Native
Place of birth - Born in state of residence (%) - Multirace
Place of birth - Born in state of residence (%) - Other Race
Place of birth - Born in other state (%)
Place of birth - Born in other state (%) - White
Place of birth - Born in other state (%) - Black or African American
Place of birth - Born in other state (%) - Asian
Place of birth - Born in other state (%) - Hispanic or Latino
Place of birth - Born in other state (%) - American Indian and Alaska Native
Place of birth - Born in other state (%) - Multirace
Place of birth - Born in other state (%) - Other Race
Place of birth - Native, outside of US (%)
Place of birth - Native, outside of US (%) - White
Place of birth - Native, outside of US (%) - Black or African American
Place of birth - Native, outside of US (%) - Asian
Place of birth - Native, outside of US (%) - Hispanic or Latino
Place of birth - Native, outside of US (%) - American Indian and Alaska Native
Place of birth - Native, outside of US (%) - Multirace
Place of birth - Native, outside of US (%) - Other Race
Place of birth - Foreign born (%)
Place of birth - Foreign born (%) - White
Place of birth - Foreign born (%) - Black or African American
Place of birth - Foreign born (%) - Asian
Place of birth - Foreign born (%) - Hispanic or Latino
Place of birth - Foreign born (%) - American Indian and Alaska Native
Place of birth - Foreign born (%) - Multirace
Place of birth - Foreign born (%) - Other Race
Residents speaking English at home (%)
Residents speaking English at home - Born in the United States (%)
Residents speaking English at home - Native, born elsewhere (%)
Residents speaking English at home - Foreign born (%)
Residents speaking Spanish at home (%)
Residents speaking Spanish at home - Born in the United States (%)
Residents speaking Spanish at home - Native, born elsewhere (%)
Residents speaking Spanish at home - Foreign born (%)
Residents speaking other language at home (%)
Residents speaking other language at home - Born in the United States (%)
Residents speaking other language at home - Native, born elsewhere (%)
Residents speaking other language at home - Foreign born (%)
Marital status - Never married (%)
Marital status - Now married (%)
Marital status - Separated (%)
Marital status - Widowed (%)
Marital status - Divorced (%)
Ancestries Reported - Arab (%)
Ancestries Reported - Czech (%)
Ancestries Reported - Danish (%)
Ancestries Reported - Dutch (%)
Ancestries Reported - English (%)
Ancestries Reported - French (%)
Ancestries Reported - French Canadian (%)
Ancestries Reported - German (%)
Ancestries Reported - Greek (%)
Ancestries Reported - Hungarian (%)
Ancestries Reported - Irish (%)
Ancestries Reported - Italian (%)
Ancestries Reported - Lithuanian (%)
Ancestries Reported - Norwegian (%)
Ancestries Reported - Polish (%)
Ancestries Reported - Portuguese (%)
Ancestries Reported - Russian (%)
Ancestries Reported - Scotch-Irish (%)
Ancestries Reported - Scottish (%)
Ancestries Reported - Slovak (%)
Ancestries Reported - Subsaharan African (%)
Ancestries Reported - Swedish (%)
Ancestries Reported - Swiss (%)
Ancestries Reported - Ukrainian (%)
Ancestries Reported - United States (%)
Ancestries Reported - Welsh (%)
Ancestries Reported - West Indian (%)
Ancestries Reported - Other (%)
Geographical mobility - Same house 1 year ago (%)
Geographical mobility - Same house 1 year ago (%) - White
Geographical mobility - Same house 1 year ago (%) - Black or African American
Geographical mobility - Same house 1 year ago (%) - Asian
Geographical mobility - Same house 1 year ago (%) - Hispanic or Latino
Geographical mobility - Same house 1 year ago (%) - American Indian and Alaska Native
Geographical mobility - Same house 1 year ago (%) - Multirace
Geographical mobility - Same house 1 year ago (%) - Other Race
Geographical mobility - Moved within same county (%)
Geographical mobility - Moved within same county (%) - White
Geographical mobility - Moved within same county (%) - Black or African American
Geographical mobility - Moved within same county (%) - Asian
Geographical mobility - Moved within same county (%) - Hispanic or Latino
Geographical mobility - Moved within same county (%) - American Indian and Alaska Native
Geographical mobility - Moved within same county (%) - Multirace
Geographical mobility - Moved within same county (%) - Other Race
Geographical mobility - Moved from different county within same state (%)
Geographical mobility - Moved from different county within same state (%) - White
Geographical mobility - Moved from different county within same state (%) - Black or African American
Geographical mobility - Moved from different county within same state (%) - Asian
Geographical mobility - Moved from different county within same state (%) - Hispanic or Latino
Geographical mobility - Moved from different county within same state (%) - American Indian and Alaska Native
Geographical mobility - Moved from different county within same state (%) - Multirace
Geographical mobility - Moved from different county within same state (%) - Other Race
Geographical mobility - Moved from different state (%)
Geographical mobility - Moved from different state (%) - White
Geographical mobility - Moved from different state (%) - Black or African American
Geographical mobility - Moved from different state (%) - Asian
Geographical mobility - Moved from different state (%) - Hispanic or Latino
Geographical mobility - Moved from different state (%) - American Indian and Alaska Native
Geographical mobility - Moved from different state (%) - Multirace
Geographical mobility - Moved from different state (%) - Other Race
Geographical mobility - Moved from abroad (%)
Geographical mobility - Moved from abroad (%) - White
Geographical mobility - Moved from abroad (%) - Black or African American
Geographical mobility - Moved from abroad (%) - Asian
Geographical mobility - Moved from abroad (%) - Hispanic or Latino
Geographical mobility - Moved from abroad (%) - American Indian and Alaska Native
Geographical mobility - Moved from abroad (%) - Multirace
Geographical mobility - Moved from abroad (%) - Other Race
Place of birth for the foreign-born population - Ireland (%)
Place of birth for the foreign-born population - Denmark (%)
Place of birth for the foreign-born population - Norway (%)
Place of birth for the foreign-born population - Sweden (%)
Place of birth for the foreign-born population - United Kingdom (%)
Place of birth for the foreign-born population - England (%)
Place of birth for the foreign-born population - Scotland (%)
Place of birth for the foreign-born population - Other Northern Europe (%)
Place of birth for the foreign-born population - Austria (%)
Place of birth for the foreign-born population - Belgium (%)
Place of birth for the foreign-born population - France (%)
Place of birth for the foreign-born population - Germany (%)
Place of birth for the foreign-born population - Netherlands (%)
Place of birth for the foreign-born population - Switzerland (%)
Place of birth for the foreign-born population - Other Western Europe (%)
Place of birth for the foreign-born population - Greece (%)
Place of birth for the foreign-born population - Italy (%)
Place of birth for the foreign-born population - Portugal (%)
Place of birth for the foreign-born population - Spain (%)
Place of birth for the foreign-born population - Other Southern Europe (%)
Place of birth for the foreign-born population - Albania (%)
Place of birth for the foreign-born population - Belarus (%)
Place of birth for the foreign-born population - Bosnia and Herzegovina (%)
Place of birth for the foreign-born population - Bulgaria (%)
Place of birth for the foreign-born population - Croatia (%)
Place of birth for the foreign-born population - Czechoslovakia (%)
Place of birth for the foreign-born population - Hungary (%)
Place of birth for the foreign-born population - Latvia (%)
Place of birth for the foreign-born population - Lithuania (%)
Place of birth for the foreign-born population - North Macedonia (Macedonia) (%)
Place of birth for the foreign-born population - Moldova (%)
Place of birth for the foreign-born population - Poland (%)
Place of birth for the foreign-born population - Romania (%)
Place of birth for the foreign-born population - Russia (%)
Place of birth for the foreign-born population - Serbia (%)
Place of birth for the foreign-born population - Ukraine (%)
Place of birth for the foreign-born population - Other Eastern Europe (%)
Place of birth for the foreign-born population - China (%)
Place of birth for the foreign-born population - Hong Kong (%)
Place of birth for the foreign-born population - Taiwan (%)
Place of birth for the foreign-born population - Japan (%)
Place of birth for the foreign-born population - Korea (%)
Place of birth for the foreign-born population - Other Eastern Asia (%)
Place of birth for the foreign-born population - Afghanistan (%)
Place of birth for the foreign-born population - Bangladesh (%)
Place of birth for the foreign-born population - India (%)
Place of birth for the foreign-born population - Iran (%)
Place of birth for the foreign-born population - Kazakhstan (%)
Place of birth for the foreign-born population - Nepal (%)
Place of birth for the foreign-born population - Pakistan (%)
Place of birth for the foreign-born population - Sri Lanka (%)
Place of birth for the foreign-born population - Uzbekistan (%)
Place of birth for the foreign-born population - Other South Central Asia (%)
Place of birth for the foreign-born population - Burma (%)
Place of birth for the foreign-born population - Cambodia (%)
Place of birth for the foreign-born population - Indonesia (%)
Place of birth for the foreign-born population - Laos (%)
Place of birth for the foreign-born population - Malaysia (%)
Place of birth for the foreign-born population - Philippines (%)
Place of birth for the foreign-born population - Singapore (%)
Place of birth for the foreign-born population - Thailand (%)
Place of birth for the foreign-born population - Vietnam (%)
Place of birth for the foreign-born population - Other South Eastern Asia (%)
Place of birth for the foreign-born population - Armenia (%)
Place of birth for the foreign-born population - Iraq (%)
Place of birth for the foreign-born population - Israel (%)
Place of birth for the foreign-born population - Jordan (%)
Place of birth for the foreign-born population - Kuwait (%)
Place of birth for the foreign-born population - Lebanon (%)
Place of birth for the foreign-born population - Saudi Arabia (%)
Place of birth for the foreign-born population - Syria (%)
Place of birth for the foreign-born population - Turkey (%)
Place of birth for the foreign-born population - Yemen (%)
Place of birth for the foreign-born population - Other Western Asia (%)
Place of birth for the foreign-born population - Eritrea (%)
Place of birth for the foreign-born population - Ethiopia (%)
Place of birth for the foreign-born population - Kenya (%)
Place of birth for the foreign-born population - Somalia (%)
Place of birth for the foreign-born population - Uganda (%)
Place of birth for the foreign-born population - Zimbabwe (%)
Place of birth for the foreign-born population - Other Eastern Africa (%)
Place of birth for the foreign-born population - Cameroon (%)
Place of birth for the foreign-born population - Congo (%)
Place of birth for the foreign-born population - Democratic Republic of Congo (Zaire) (%)
Place of birth for the foreign-born population - Other Middle Africa (%)
Place of birth for the foreign-born population - Egypt (%)
Place of birth for the foreign-born population - Morocco (%)
Place of birth for the foreign-born population - Sudan (%)
Place of birth for the foreign-born population - Other Northern Africa (%)
Place of birth for the foreign-born population - South Africa (%)
Place of birth for the foreign-born population - Other Southern Africa (%)
Place of birth for the foreign-born population - Cabo Verde (%)
Place of birth for the foreign-born population - Ghana (%)
Place of birth for the foreign-born population - Liberia (%)
Place of birth for the foreign-born population - Nigeria (%)
Place of birth for the foreign-born population - Senegal (%)
Place of birth for the foreign-born population - Sierra Leone (%)
Place of birth for the foreign-born population - Other Western Africa (%)
Place of birth for the foreign-born population - Australia (%)
Place of birth for the foreign-born population - New Zealand (%)
Place of birth for the foreign-born population - Fiji (%)
Place of birth for the foreign-born population - Micronesia (%)
Place of birth for the foreign-born population - Bahamas (%)
Place of birth for the foreign-born population - Barbados (%)
Place of birth for the foreign-born population - Cuba (%)
Place of birth for the foreign-born population - Dominica (%)
Place of birth for the foreign-born population - Dominican Republic (%)
Place of birth for the foreign-born population - Grenada (%)
Place of birth for the foreign-born population - Haiti (%)
Place of birth for the foreign-born population - Jamaica (%)
Place of birth for the foreign-born population - St. Vincent and the Grenadines (%)
Place of birth for the foreign-born population - Trinidad and Tobago (%)
Place of birth for the foreign-born population - West Indies (%)
Place of birth for the foreign-born population - Other Caribbean (%)
Place of birth for the foreign-born population - Belize (%)
Place of birth for the foreign-born population - Costa Rica (%)
Place of birth for the foreign-born population - El Salvador (%)
Place of birth for the foreign-born population - Guatemala (%)
Place of birth for the foreign-born population - Honduras (%)
Place of birth for the foreign-born population - Mexico (%)
Place of birth for the foreign-born population - Nicaragua (%)
Place of birth for the foreign-born population - Panama (%)
Place of birth for the foreign-born population - Other Central America (%)
Place of birth for the foreign-born population - Argentina (%)
Place of birth for the foreign-born population - Bolivia (%)
Place of birth for the foreign-born population - Brazil (%)
Place of birth for the foreign-born population - Chile (%)
Place of birth for the foreign-born population - Colombia (%)
Place of birth for the foreign-born population - Ecuador (%)
Place of birth for the foreign-born population - Guyana (%)
Place of birth for the foreign-born population - Peru (%)
Place of birth for the foreign-born population - Uruguay (%)
Place of birth for the foreign-born population - Venezuela (%)
Place of birth for the foreign-born population - Other South America (%)
Place of birth for the foreign-born population - Canada (%)
Place of birth for the foreign-born population - Other Northern America (%)
Place of birth for the foreign-born population - Other (%)
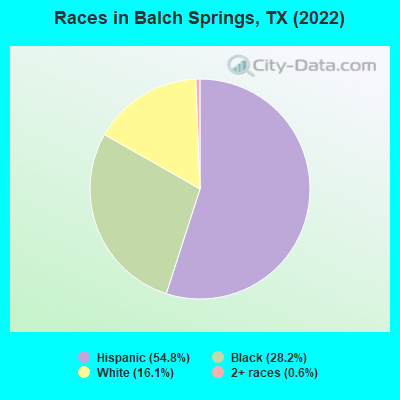
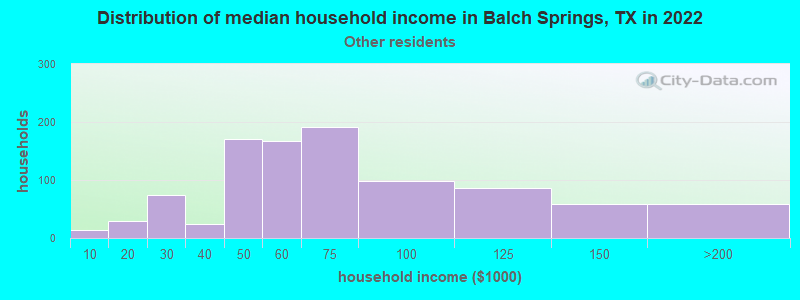
According to 2022 data, the most numerous races in Balch Springs, TX are Hispanic (14,953 residents), White alone (4,400 residents), and Black alone (7,684 residents). 52.8% of Balch Springs residents speak English at home. 24.6% of Balch Springs, TX residents are foreign-born (22.5% born in Latin America), which is 30.9% greater than the foreign-born rate of 17.0% across the entire state of Texas.
Race distribution in Balch Springs
2000 2022
10,933,313 52.4% White alone 6,669,666 32.0% Hispanic 2,364,255 11.3% Black alone 554,445 2.7% Asian alone 230,567 1.1% Two or more races 68,859 0.3% American Indian alone 19,958 0.10% Other race alone 10,757 0.05% Native Hawaiian and Other
12,070,642 40.2% Hispanic 11,683,430 38.9% White alone 3,508,706 11.7% Black alone 1,608,173 5.4% Asian alone 956,560 3.2% Two or more races 125,763 0.4% Other race alone 47,023 0.2% American Indian alone 29,275 0.10% Native Hawaiian and Other
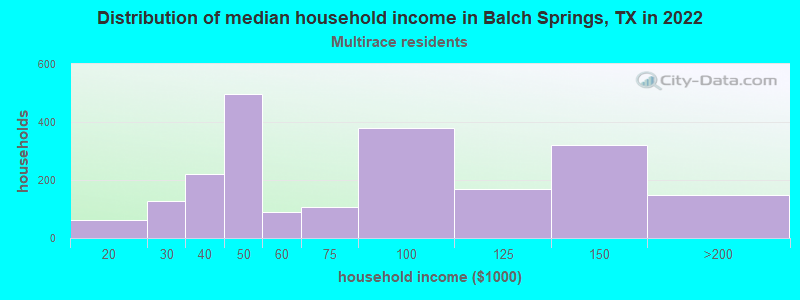
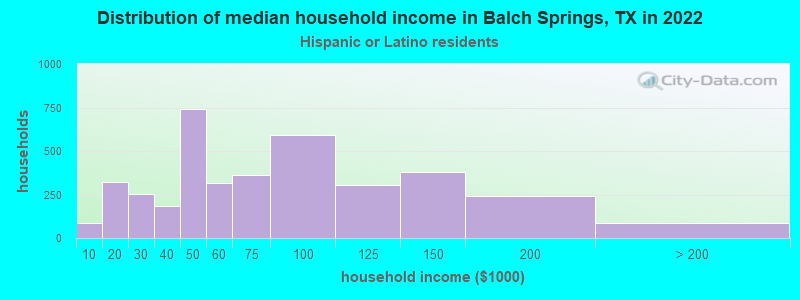
Income and house value in Balch Springs Median household income in 2022 $58,924 White non-Hispanic householders$62,977 Black householders$60,418 Some other race householders$69,316 Two or more races householders$58,609 Hispanic or Latino race householdersMedian 2022 house value $212,862 White Non-Hispanic householders$289,186 Black or African American householders$255,051 American Indian or Alaska Native householders $287,652 Asian householders$201,739 Some other race householders$148,044 Two or more races householders$209,027 Hispanic or Latino householders
Median age by race in Balch Springs
34.5 Median age for White residents31.8 40.3 35.4 Median age for Black or African American residents30.3 37.9 36.2 Median age for American Indian / Alaska Native residents29.2 40.1 -681,948,423.4 Median age for Asian residents-680,115,273.1 -689,523,808.8 -711,469,533.3 Median age for Native Hawaiian / Pacific Islander residents-815,813,116.9 -464,594,127.3 29.8 Median age for Other race residents36.8 25.2 23.7 Median age for Two or more races residents24.8 21.8 46.5 Median age for White alone residents41.9 50.0 26.6 Median age for Hispanic or Latino residents26.8 26.4
Owner/renter occupied households by race in Balch Springs
House owners and renters - White residents 1,793 63.5% Owner occupied1,032 36.5% Renter occupiedHouse owners and renters - Black or African American residents 1,317 46.6% Owner occupied1,510 53.4% Renter occupiedHouse owners and renters - American Indian / Alaska Native residents 70 100.0% Owner occupiedHouse owners and renters - Asian residents 17 100.0% Renter occupiedHouse owners and renters - Other race residents 768 75.3% Owner occupied251 24.7% Renter occupiedHouse owners and renters - Two or more races residents 1,756 83.2% Owner occupied356 16.8% Renter occupiedHouse owners and renters - White alone residents 1,019 58.6% Owner occupied721 41.4% Renter occupiedHouse owners and renters - Hispanic or Latino residents 2,890 74.2% Owner occupied1,006 25.8% Renter occupied
Language usage in Balch Springs
English speakers - Total 52.8% of residents of Balch Springs speak English at home.
45.9% of residents speak Spanish at home 6,301 54.2% Speak English very well5,328 45.8% Speak English less than very well1.2% of residents speak other language at home 251 85.4% Speak English very well43 14.6% Speak English less than very well
English speakers - Born in the United States 80.6% of residents of Balch Springs speak English at home.
20.4% of residents speak Spanish at home 554 85.4% Speak English very well95 14.6% Speak English less than very well0.4% of residents speak other language at home 13 100.0% Speak English very well
English speakers - Native, born elsewhere 0.0% of residents of Balch Springs speak English at home.
75.4% of residents speak Spanish at home 68 76.4% Speak English very well21 23.6% Speak English less than very well
English speakers - Foreign-born 5.8% of residents of Balch Springs speak English at home.
89.5% of residents speak Spanish at home 1,242 21.7% Speak English very well4,471 78.3% Speak English less than very well4.1% of residents speak other language at home 221 84.0% Speak English very well42 16.0% Speak English less than very well
White (Caucasian) - Speak only English Native:
76.4% (4,405)Foreign-born:
5.4% (70)
White (Caucasian) - Speak another language Native:
17.7% (1,019)Foreign-born:
85.3% (1,102)
Black or African American - Speak only English Native:
97.5% (7,165)Foreign-born:
8.2% (22)
Black or African American - Speak another language Native:
2.6% (188)Foreign-born:
94.6% (253)
American Indian / Alaska Native - Speak only English Native:
29.4% (36)Foreign-born:
12.5% (25)
American Indian / Alaska Native - Speak another language Native:
75.3% (92)Foreign-born:
81.9% (162)
Other race - Speak only English Native:
16.8% (369)Foreign-born:
16.2% (263)
Other race - Speak another language Native:
83.0% (1,823)Foreign-born:
83.7% (1,359)
Two or more races - Speak another language Native:
80.0% (3,485)Foreign-born:
99.3% (3,523)
White alone - Speak only English Native:
93.8% (3,772)Foreign-born:
39.5% (25)
White alone - Speak another language Native:
5.7% (228)Foreign-born:
60.6% (39)
Hispanic or Latino - Speak only English Native:
25.2% (1,908)Foreign-born:
6.3% (380)
Hispanic or Latino - Speak another language Native:
74.6% (5,639)Foreign-born:
94.2% (5,710)
Foreign-born residents in Balch Springs 6,715 residents are foreign born (22.5% Latin America ).
This city:
24.6%Texas:
17.1%
Marital status for residents in Balch Springs Marital status - White (Caucasian) population 15 years and over
Males 39.7% Never married48.7% Now married0.0% Separated4.4% Widowed7.2% DivorcedFemales 26.7% Never married40.8% Now married3.6% Separated11.2% Widowed17.7% DivorcedWomen who gave birth in the past 12 months Now married:
55.7% (34)Unmarried:
44.3% (27)
Women who did not give birth in the past 12 months Now married:
45.7% (726)Unmarried:
54.3% (861)
Marital status - Black or African American population 15 years and over
Males 52.1% Never married40.0% Now married1.3% Separated0.3% Widowed6.3% DivorcedFemales 41.7% Never married33.5% Now married4.2% Separated8.1% Widowed12.5% DivorcedWomen who gave birth in the past 12 months Now married:
54.1% (77)Unmarried:
45.9% (66)
Women who did not give birth in the past 12 months Now married:
22.4% (351)Unmarried:
77.6% (1,217)
Marital status - American Indian / Alaska Native population 15 years and over
Males 33.7% Never married66.3% Now married0.0% Separated0.0% Widowed0.0% DivorcedFemales 46.5% Never married44.4% Now married0.0% Separated0.0% Widowed9.2% DivorcedWomen who did not give birth in the past 12 months Now married:
0.0% (0)Unmarried:
100.0% (64)
Marital status - Other race population 15 years and over
Males 42.0% Never married54.8% Now married0.0% Separated0.0% Widowed3.2% DivorcedFemales 39.8% Never married50.1% Now married3.3% Separated2.9% Widowed3.9% DivorcedWomen who gave birth in the past 12 months Now married:
100.0% (114)Unmarried:
0.0% (0)
Women who did not give birth in the past 12 months Now married:
40.2% (477)Unmarried:
59.8% (708)
Marital status - Two or more races population 15 years and over
Males 31.6% Never married57.6% Now married0.0% Separated0.3% Widowed10.5% DivorcedFemales 41.6% Never married45.1% Now married2.2% Separated4.2% Widowed6.9% DivorcedWomen who gave birth in the past 12 months Now married:
70.3% (186)Unmarried:
29.7% (79)
Women who did not give birth in the past 12 months Now married:
41.5% (947)Unmarried:
58.5% (1,336)
Marital status - White alone, not Hispanic / Latino population 15 years and over
Males 30.3% Never married52.3% Now married0.0% Separated10.0% Widowed7.4% DivorcedFemales 14.2% Never married41.8% Now married2.8% Separated15.5% Widowed25.8% DivorcedWomen who gave birth in the past 12 months Now married:
100.0% (20)Unmarried:
0.0% (0)
Women who did not give birth in the past 12 months Now married:
53.9% (466)Unmarried:
46.1% (398)
Marital status - Hispanic or Latino population 15 years and over
Males 41.3% Never married51.6% Now married0.0% Separated0.1% Widowed7.0% DivorcedFemales 40.6% Never married44.2% Now married3.3% Separated4.6% Widowed7.2% DivorcedWomen who gave birth in the past 12 months Now married:
71.6% (220)Unmarried:
28.4% (87)
Women who did not give birth in the past 12 months Now married:
40.5% (1,485)Unmarried:
59.5% (2,186)
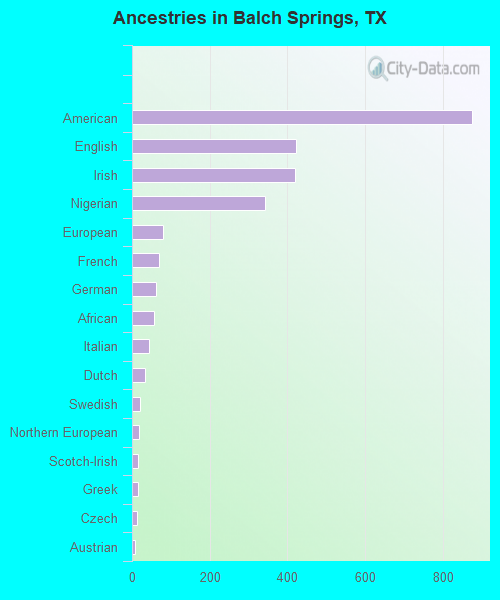
Ancestries in Balch Springs
875 4.6% American422 2.2% English420 2.2% Irish342 1.8% Nigerian80 0.4% European69 0.4% French62 0.3% German57 0.3% African43 0.2% Italian34 0.2% Dutch21 0.1% Swedish18 0.10% Northern European16 0.08% Scotch-Irish15 0.08% Greek14 0.07% Czech9 0.05% Austrian
Geographical mobility in Balch Springs Same house 1 year ago 6,697 88.4% White (Caucasian)6,665 84.2% Black or African American377 100.0% American Indian / Alaska Native16 79.6% Asian3,879 90.0% Other race6,893 84.0% Two or more races3,999 91.8% White alone, not Hispanic / Latino12,632 86.8% Hispanic or LatinoMoved within same county 570 7.5% White / Caucasian1,145 14.5% Black or African American3 13.1% Asian226 5.2% Other race1,027 12.5% Two or more races279 6.4% White alone, not Hispanic / Latino1,271 8.7% Hispanic or LatinoMoved within same state 62 0.8% White / Caucasian25 0.3% Black or African American209 2.5% Two or more races63 1.5% White alone, not Hispanic / Latino136 0.9% Hispanic or LatinoMoved from different state 32 0.4% Black or African American246 5.7% Other race164 1.1% Hispanic or LatinoMoved from abroad 135 1.8% White66 0.8% Two or more races371 2.5% Hispanic or Latino
Children Nativity (place of birth) in Balch Springs
Children under 6 years - Living with two parents Both parents native 631 100.0% NativeBoth parents foreign-born 405 100.0% NativeOne native, one foreign-born parent 301 100.0% NativeChildren under 6 years - Living with one parent Native parent 423 100.0% NativeForeign-born parent 197 100.0% NativeChildren 6 to 17 years - Living with two parents Both parents native 710 98.7% Native9 1.3% Foreign-bornBoth parents foreign-born 1,364 82.7% Native285 17.3% Foreign-bornOne native, one foreign-born parent 585 100.0% NativeChildren 6 to 17 years - Living with one parent Native parent 1,639 100.0% NativeForeign-born parent 777 51.7% Native726 48.3% Foreign-born
Grandparents responsible for own grandchildren in Balch Springs
Grandparents (30 to 59 years) White / Caucasian 44 38.0% Responsible for grandchildren72 62.0% Not responsible for grandchildrenBlack or African American 25 74.9% Responsible for grandchildren8 25.1% Not responsible for grandchildrenAmerican Indian / Alaska Native 112 100.0% Not responsible for grandchildrenOther race 186 60.9% Responsible for grandchildren119 39.1% Not responsible for grandchildrenTwo or more races 190 71.4% Responsible for grandchildren76 28.6% Not responsible for grandchildrenWhite alone, not Hispanic / Latino 40 39.3% Responsible for grandchildren62 60.7% Not responsible for grandchildrenHispanic or Latino 268 55.7% Responsible for grandchildren214 44.3% Not responsible for grandchildrenGrandparents (60 years and over) White / Caucasian 73 51.7% Responsible for grandchildren68 48.3% Not responsible for grandchildrenBlack or African American 51 58.4% Responsible for grandchildren36 41.6% Not responsible for grandchildrenAmerican Indian / Alaska Native 31 100.0% Responsible for grandchildrenOther race 111 100.0% Not responsible for grandchildrenTwo or more races 19 11.4% Responsible for grandchildren152 88.6% Not responsible for grandchildrenWhite alone, not Hispanic / Latino 93 60.3% Responsible for grandchildren61 39.7% Not responsible for grandchildrenHispanic or Latino 22 8.8% Responsible for grandchildren229 91.2% Not responsible for grandchildren