Estimated zip code population in 2022: 89,497
Zip code population in 2010: 80,324
Zip code population in 2000: 72,897
Houses and condos: 26,442
Renter-occupied apartments: 10,476
% of renters here:
42%State:
38%
March 2022 cost of living index in zip code 75217: 93.6
(less than average, U.S. average is 100)
Land area: 27.3
sq. mi.
Water area: 1.0
sq. mi.
Population density: 3,275 people per square mile (average).
OSM Map
General Map
Google Map
MSN Map
OSM Map
General Map
Google Map
MSN Map
OSM Map
General Map
Google Map
MSN Map
OSM Map
General Map
Google Map
MSN Map
Please wait while loading the map...
Real estate property taxes paid for housing units in 2022:
This zip code:
1.1% ($1,823)Texas:
1.5% ($4,050)
Median real estate property taxes paid for housing units with mortgages in 2022: $2,063 (1.2%)
Median real estate property taxes paid for housing units with no mortgage in 2022: $1,689 (1.1%)
Profiles of local businesses
Business Search - 14 Million verified businesses
Males: 44,850 Females: 44,646
For population 25 years and over in 75217:
High school or higher: 56.7%Bachelor's degree or higher: 5.6%Graduate or professional degree: 1.1%Unemployed: 3.3%Mean travel time to work (commute): 35.5 minutes
For population 15 years and over in 75217:
Never married: 37.7%Now married: 49.8%Separated: 2.6%Widowed: 4.0%Divorced: 5.8%
Zip code 75217 compared to state average:
Median house value below state average. Hispanic race population percentage above state average. Median age below state average. Foreign-born population percentage above state average. Length of stay since moving in significantly above state average. House age above state average. Percentage of population with a bachelor's degree or higher significantly below state average. 67,233 75.1% Hispanic or Latino 15,755 17.6% Black 5,186 5.8% White 663 0.7% Two or more races 421 0.5% Asian 118 0.1% American Indian 103 0.1% Some other race 15 0.02% Native Hawaiian and Other
Data:
Median household income ($)
Median household income (% change since 2000)
Household income diversity
Ratio of average income to average house value (%)
Ratio of average income to average rent
Median household income ($) - White
Median household income ($) - Black or African American
Median household income ($) - Asian
Median household income ($) - Hispanic or Latino
Median household income ($) - American Indian and Alaska Native
Median household income ($) - Multirace
Median household income ($) - Other Race
Median household income for houses/condos with a mortgage ($)
Median household income for apartments without a mortgage ($)
Races - White alone (%)
Races - White alone (% change since 2000)
Races - Black alone (%)
Races - Black alone (% change since 2000)
Races - American Indian alone (%)
Races - American Indian alone (% change since 2000)
Races - Asian alone (%)
Races - Asian alone (% change since 2000)
Races - Hispanic (%)
Races - Hispanic (% change since 2000)
Races - Native Hawaiian and Other Pacific Islander alone (%)
Races - Native Hawaiian and Other Pacific Islander alone (% change since 2000)
Races - Two or more races (%)
Races - Two or more races (% change since 2000)
Races - Other race alone (%)
Races - Other race alone (% change since 2000)
Racial diversity
Unemployment (%)
Unemployment (% change since 2000)
Unemployment (%) - White
Unemployment (%) - Black or African American
Unemployment (%) - Asian
Unemployment (%) - Hispanic or Latino
Unemployment (%) - American Indian and Alaska Native
Unemployment (%) - Multirace
Unemployment (%) - Other Race
Population density (people per square mile)
Population - Males (%)
Population - Females (%)
Population - Males (%) - White
Population - Males (%) - Black or African American
Population - Males (%) - Asian
Population - Males (%) - Hispanic or Latino
Population - Males (%) - American Indian and Alaska Native
Population - Males (%) - Multirace
Population - Males (%) - Other Race
Population - Females (%) - White
Population - Females (%) - Black or African American
Population - Females (%) - Asian
Population - Females (%) - Hispanic or Latino
Population - Females (%) - American Indian and Alaska Native
Population - Females (%) - Multirace
Population - Females (%) - Other Race
Coronavirus confirmed cases (Jun 02, 2024)
Deaths caused by coronavirus (Jun 02, 2024)
Coronavirus confirmed cases (per 100k population) (Jun 02, 2024)
Deaths caused by coronavirus (per 100k population) (Jun 02, 2024)
Daily increase in number of cases (Jun 02, 2024)
Weekly increase in number of cases (Jun 02, 2024)
Cases doubled (in days) (Jun 02, 2024)
Hospitalized patients (Apr 18, 2022)
Negative test results (Apr 18, 2022)
Total test results (Apr 18, 2022)
COVID Vaccine doses distributed (per 100k population) (Sep 19, 2023)
COVID Vaccine doses administered (per 100k population) (Sep 19, 2023)
COVID Vaccine doses distributed (Sep 19, 2023)
COVID Vaccine doses administered (Sep 19, 2023)
Likely homosexual households (%)
Likely homosexual households (% change since 2000)
Likely homosexual households - Lesbian couples (%)
Likely homosexual households - Lesbian couples (% change since 2000)
Likely homosexual households - Gay men (%)
Likely homosexual households - Gay men (% change since 2000)
Cost of living index
Median gross rent ($)
Median contract rent ($)
Median monthly housing costs ($)
Median house or condo value ($)
Median house or condo value ($ change since 2000)
Mean house or condo value by units in structure - 1, detached ($)
Mean house or condo value by units in structure - 1, attached ($)
Mean house or condo value by units in structure - 2 ($)
Mean house or condo value by units in structure by units in structure - 3 or 4 ($)
Mean house or condo value by units in structure - 5 or more ($)
Mean house or condo value by units in structure - Boat, RV, van, etc. ($)
Mean house or condo value by units in structure - Mobile home ($)
Median house or condo value ($) - White
Median house or condo value ($) - Black or African American
Median house or condo value ($) - Asian
Median house or condo value ($) - Hispanic or Latino
Median house or condo value ($) - American Indian and Alaska Native
Median house or condo value ($) - Multirace
Median house or condo value ($) - Other Race
Median resident age
Resident age diversity
Median resident age - Males
Median resident age - Females
Median resident age - White
Median resident age - Black or African American
Median resident age - Asian
Median resident age - Hispanic or Latino
Median resident age - American Indian and Alaska Native
Median resident age - Multirace
Median resident age - Other Race
Median resident age - Males - White
Median resident age - Males - Black or African American
Median resident age - Males - Asian
Median resident age - Males - Hispanic or Latino
Median resident age - Males - American Indian and Alaska Native
Median resident age - Males - Multirace
Median resident age - Males - Other Race
Median resident age - Females - White
Median resident age - Females - Black or African American
Median resident age - Females - Asian
Median resident age - Females - Hispanic or Latino
Median resident age - Females - American Indian and Alaska Native
Median resident age - Females - Multirace
Median resident age - Females - Other Race
Commute - mean travel time to work (minutes)
Travel time to work - Less than 5 minutes (%)
Travel time to work - Less than 5 minutes (% change since 2000)
Travel time to work - 5 to 9 minutes (%)
Travel time to work - 5 to 9 minutes (% change since 2000)
Travel time to work - 10 to 19 minutes (%)
Travel time to work - 10 to 19 minutes (% change since 2000)
Travel time to work - 20 to 29 minutes (%)
Travel time to work - 20 to 29 minutes (% change since 2000)
Travel time to work - 30 to 39 minutes (%)
Travel time to work - 30 to 39 minutes (% change since 2000)
Travel time to work - 40 to 59 minutes (%)
Travel time to work - 40 to 59 minutes (% change since 2000)
Travel time to work - 60 to 89 minutes (%)
Travel time to work - 60 to 89 minutes (% change since 2000)
Travel time to work - 90 or more minutes (%)
Travel time to work - 90 or more minutes (% change since 2000)
Marital status - Never married (%)
Marital status - Now married (%)
Marital status - Separated (%)
Marital status - Widowed (%)
Marital status - Divorced (%)
Median family income ($)
Median family income (% change since 2000)
Median non-family income ($)
Median non-family income (% change since 2000)
Median per capita income ($)
Median per capita income (% change since 2000)
Median family income ($) - White
Median family income ($) - Black or African American
Median family income ($) - Asian
Median family income ($) - Hispanic or Latino
Median family income ($) - American Indian and Alaska Native
Median family income ($) - Multirace
Median family income ($) - Other Race
Median year house/condo built
Median year apartment built
Year house built - Built 2005 or later (%)
Year house built - Built 2000 to 2004 (%)
Year house built - Built 1990 to 1999 (%)
Year house built - Built 1980 to 1989 (%)
Year house built - Built 1970 to 1979 (%)
Year house built - Built 1960 to 1969 (%)
Year house built - Built 1950 to 1959 (%)
Year house built - Built 1940 to 1949 (%)
Year house built - Built 1939 or earlier (%)
Average household size
Household density (households per square mile)
Average household size - White
Average household size - Black or African American
Average household size - Asian
Average household size - Hispanic or Latino
Average household size - American Indian and Alaska Native
Average household size - Multirace
Average household size - Other Race
Occupied housing units (%)
Vacant housing units (%)
Owner occupied housing units (%)
Renter occupied housing units (%)
Vacancy status - For rent (%)
Vacancy status - For sale only (%)
Vacancy status - Rented or sold, not occupied (%)
Vacancy status - For seasonal, recreational, or occasional use (%)
Vacancy status - For migrant workers (%)
Vacancy status - Other vacant (%)
Residents with income below the poverty level (%)
Residents with income below 50% of the poverty level (%)
Children below poverty level (%)
Poor families by family type - Married-couple family (%)
Poor families by family type - Male, no wife present (%)
Poor families by family type - Female, no husband present (%)
Poverty status for native-born residents (%)
Poverty status for foreign-born residents (%)
Poverty among high school graduates not in families (%)
Poverty among people who did not graduate high school not in families (%)
Residents with income below the poverty level (%) - White
Residents with income below the poverty level (%) - Black or African American
Residents with income below the poverty level (%) - Asian
Residents with income below the poverty level (%) - Hispanic or Latino
Residents with income below the poverty level (%) - American Indian and Alaska Native
Residents with income below the poverty level (%) - Multirace
Residents with income below the poverty level (%) - Other Race
Air pollution - Air Quality Index (AQI)
Air pollution - CO
Air pollution - NO2
Air pollution - SO2
Air pollution - Ozone
Air pollution - PM10
Air pollution - PM25
Air pollution - Pb
Crime - Murders per 100,000 population
Crime - Rapes per 100,000 population
Crime - Robberies per 100,000 population
Crime - Assaults per 100,000 population
Crime - Burglaries per 100,000 population
Crime - Thefts per 100,000 population
Crime - Auto thefts per 100,000 population
Crime - Arson per 100,000 population
Crime - City-data.com crime index
Crime - Violent crime index
Crime - Property crime index
Crime - Murders per 100,000 population (5 year average)
Crime - Rapes per 100,000 population (5 year average)
Crime - Robberies per 100,000 population (5 year average)
Crime - Assaults per 100,000 population (5 year average)
Crime - Burglaries per 100,000 population (5 year average)
Crime - Thefts per 100,000 population (5 year average)
Crime - Auto thefts per 100,000 population (5 year average)
Crime - Arson per 100,000 population (5 year average)
Crime - City-data.com crime index (5 year average)
Crime - Violent crime index (5 year average)
Crime - Property crime index (5 year average)
1996 Presidential Elections Results (%) - Democratic Party (Clinton)
1996 Presidential Elections Results (%) - Republican Party (Dole)
1996 Presidential Elections Results (%) - Other
2000 Presidential Elections Results (%) - Democratic Party (Gore)
2000 Presidential Elections Results (%) - Republican Party (Bush)
2000 Presidential Elections Results (%) - Other
2004 Presidential Elections Results (%) - Democratic Party (Kerry)
2004 Presidential Elections Results (%) - Republican Party (Bush)
2004 Presidential Elections Results (%) - Other
2008 Presidential Elections Results (%) - Democratic Party (Obama)
2008 Presidential Elections Results (%) - Republican Party (McCain)
2008 Presidential Elections Results (%) - Other
2012 Presidential Elections Results (%) - Democratic Party (Obama)
2012 Presidential Elections Results (%) - Republican Party (Romney)
2012 Presidential Elections Results (%) - Other
2016 Presidential Elections Results (%) - Democratic Party (Clinton)
2016 Presidential Elections Results (%) - Republican Party (Trump)
2016 Presidential Elections Results (%) - Other
2020 Presidential Elections Results (%) - Democratic Party (Biden)
2020 Presidential Elections Results (%) - Republican Party (Trump)
2020 Presidential Elections Results (%) - Other
Ancestries Reported - Arab (%)
Ancestries Reported - Czech (%)
Ancestries Reported - Danish (%)
Ancestries Reported - Dutch (%)
Ancestries Reported - English (%)
Ancestries Reported - French (%)
Ancestries Reported - French Canadian (%)
Ancestries Reported - German (%)
Ancestries Reported - Greek (%)
Ancestries Reported - Hungarian (%)
Ancestries Reported - Irish (%)
Ancestries Reported - Italian (%)
Ancestries Reported - Lithuanian (%)
Ancestries Reported - Norwegian (%)
Ancestries Reported - Polish (%)
Ancestries Reported - Portuguese (%)
Ancestries Reported - Russian (%)
Ancestries Reported - Scotch-Irish (%)
Ancestries Reported - Scottish (%)
Ancestries Reported - Slovak (%)
Ancestries Reported - Subsaharan African (%)
Ancestries Reported - Swedish (%)
Ancestries Reported - Swiss (%)
Ancestries Reported - Ukrainian (%)
Ancestries Reported - United States (%)
Ancestries Reported - Welsh (%)
Ancestries Reported - West Indian (%)
Ancestries Reported - Other (%)
Educational Attainment - No schooling completed (%)
Educational Attainment - Less than high school (%)
Educational Attainment - High school or equivalent (%)
Educational Attainment - Less than 1 year of college (%)
Educational Attainment - 1 or more years of college (%)
Educational Attainment - Associate degree (%)
Educational Attainment - Bachelor's degree (%)
Educational Attainment - Master's degree (%)
Educational Attainment - Professional school degree (%)
Educational Attainment - Doctorate degree (%)
School Enrollment - Nursery, preschool (%)
School Enrollment - Kindergarten (%)
School Enrollment - Grade 1 to 4 (%)
School Enrollment - Grade 5 to 8 (%)
School Enrollment - Grade 9 to 12 (%)
School Enrollment - College undergrad (%)
School Enrollment - Graduate or professional (%)
School Enrollment - Not enrolled in school (%)
School enrollment - Public schools (%)
School enrollment - Private schools (%)
School enrollment - Not enrolled (%)
Median number of rooms in houses and condos
Median number of rooms in apartments
Housing units lacking complete plumbing facilities (%)
Housing units lacking complete kitchen facilities (%)
Density of houses
Urban houses (%)
Rural houses (%)
Households with people 60 years and over (%)
Households with people 65 years and over (%)
Households with people 75 years and over (%)
Households with one or more nonrelatives (%)
Households with no nonrelatives (%)
Population in households (%)
Family households (%)
Nonfamily households (%)
Population in families (%)
Family households with own children (%)
Median number of bedrooms in owner occupied houses
Mean number of bedrooms in owner occupied houses
Median number of bedrooms in renter occupied houses
Mean number of bedrooms in renter occupied houses
Median number of vehichles in owner occupied houses
Mean number of vehichles in owner occupied houses
Median number of vehichles in renter occupied houses
Mean number of vehichles in renter occupied houses
Mortgage status - with mortgage (%)
Mortgage status - with second mortgage (%)
Mortgage status - with home equity loan (%)
Mortgage status - with both second mortgage and home equity loan (%)
Mortgage status - without a mortgage (%)
Average family size
Average family size - White
Average family size - Black or African American
Average family size - Asian
Average family size - Hispanic or Latino
Average family size - American Indian and Alaska Native
Average family size - Multirace
Average family size - Other Race
Geographical mobility - Same house 1 year ago (%)
Geographical mobility - Moved within same county (%)
Geographical mobility - Moved from different county within same state (%)
Geographical mobility - Moved from different state (%)
Geographical mobility - Moved from abroad (%)
Place of birth - Born in state of residence (%)
Place of birth - Born in other state (%)
Place of birth - Native, outside of US (%)
Place of birth - Foreign born (%)
Housing units in structures - 1, detached (%)
Housing units in structures - 1, attached (%)
Housing units in structures - 2 (%)
Housing units in structures - 3 or 4 (%)
Housing units in structures - 5 to 9 (%)
Housing units in structures - 10 to 19 (%)
Housing units in structures - 20 to 49 (%)
Housing units in structures - 50 or more (%)
Housing units in structures - Mobile home (%)
Housing units in structures - Boat, RV, van, etc. (%)
House/condo owner moved in on average (years ago)
Renter moved in on average (years ago)
Year householder moved into unit - Moved in 1999 to March 2000 (%)
Year householder moved into unit - Moved in 1995 to 1998 (%)
Year householder moved into unit - Moved in 1990 to 1994 (%)
Year householder moved into unit - Moved in 1980 to 1989 (%)
Year householder moved into unit - Moved in 1970 to 1979 (%)
Year householder moved into unit - Moved in 1969 or earlier (%)
Means of transportation to work - Drove car alone (%)
Means of transportation to work - Carpooled (%)
Means of transportation to work - Public transportation (%)
Means of transportation to work - Bus or trolley bus (%)
Means of transportation to work - Streetcar or trolley car (%)
Means of transportation to work - Subway or elevated (%)
Means of transportation to work - Railroad (%)
Means of transportation to work - Ferryboat (%)
Means of transportation to work - Taxicab (%)
Means of transportation to work - Motorcycle (%)
Means of transportation to work - Bicycle (%)
Means of transportation to work - Walked (%)
Means of transportation to work - Other means (%)
Working at home (%)
Industry diversity
Most Common Industries - Agriculture, forestry, fishing and hunting, and mining (%)
Most Common Industries - Agriculture, forestry, fishing and hunting (%)
Most Common Industries - Mining, quarrying, and oil and gas extraction (%)
Most Common Industries - Construction (%)
Most Common Industries - Manufacturing (%)
Most Common Industries - Wholesale trade (%)
Most Common Industries - Retail trade (%)
Most Common Industries - Transportation and warehousing, and utilities (%)
Most Common Industries - Transportation and warehousing (%)
Most Common Industries - Utilities (%)
Most Common Industries - Information (%)
Most Common Industries - Finance and insurance, and real estate and rental and leasing (%)
Most Common Industries - Finance and insurance (%)
Most Common Industries - Real estate and rental and leasing (%)
Most Common Industries - Professional, scientific, and management, and administrative and waste management services (%)
Most Common Industries - Professional, scientific, and technical services (%)
Most Common Industries - Management of companies and enterprises (%)
Most Common Industries - Administrative and support and waste management services (%)
Most Common Industries - Educational services, and health care and social assistance (%)
Most Common Industries - Educational services (%)
Most Common Industries - Health care and social assistance (%)
Most Common Industries - Arts, entertainment, and recreation, and accommodation and food services (%)
Most Common Industries - Arts, entertainment, and recreation (%)
Most Common Industries - Accommodation and food services (%)
Most Common Industries - Other services, except public administration (%)
Most Common Industries - Public administration (%)
Occupation diversity
Most Common Occupations - Management, business, science, and arts occupations (%)
Most Common Occupations - Management, business, and financial occupations (%)
Most Common Occupations - Management occupations (%)
Most Common Occupations - Business and financial operations occupations (%)
Most Common Occupations - Computer, engineering, and science occupations (%)
Most Common Occupations - Computer and mathematical occupations (%)
Most Common Occupations - Architecture and engineering occupations (%)
Most Common Occupations - Life, physical, and social science occupations (%)
Most Common Occupations - Education, legal, community service, arts, and media occupations (%)
Most Common Occupations - Community and social service occupations (%)
Most Common Occupations - Legal occupations (%)
Most Common Occupations - Education, training, and library occupations (%)
Most Common Occupations - Arts, design, entertainment, sports, and media occupations (%)
Most Common Occupations - Healthcare practitioners and technical occupations (%)
Most Common Occupations - Health diagnosing and treating practitioners and other technical occupations (%)
Most Common Occupations - Health technologists and technicians (%)
Most Common Occupations - Service occupations (%)
Most Common Occupations - Healthcare support occupations (%)
Most Common Occupations - Protective service occupations (%)
Most Common Occupations - Fire fighting and prevention, and other protective service workers including supervisors (%)
Most Common Occupations - Law enforcement workers including supervisors (%)
Most Common Occupations - Food preparation and serving related occupations (%)
Most Common Occupations - Building and grounds cleaning and maintenance occupations (%)
Most Common Occupations - Personal care and service occupations (%)
Most Common Occupations - Sales and office occupations (%)
Most Common Occupations - Sales and related occupations (%)
Most Common Occupations - Office and administrative support occupations (%)
Most Common Occupations - Natural resources, construction, and maintenance occupations (%)
Most Common Occupations - Farming, fishing, and forestry occupations (%)
Most Common Occupations - Construction and extraction occupations (%)
Most Common Occupations - Installation, maintenance, and repair occupations (%)
Most Common Occupations - Production, transportation, and material moving occupations (%)
Most Common Occupations - Production occupations (%)
Most Common Occupations - Transportation occupations (%)
Most Common Occupations - Material moving occupations (%)
People in Group quarters - Institutionalized population (%)
People in Group quarters - Correctional institutions (%)
People in Group quarters - Federal prisons and detention centers (%)
People in Group quarters - Halfway houses (%)
People in Group quarters - Local jails and other confinement facilities (including police lockups) (%)
People in Group quarters - Military disciplinary barracks (%)
People in Group quarters - State prisons (%)
People in Group quarters - Other types of correctional institutions (%)
People in Group quarters - Nursing homes (%)
People in Group quarters - Hospitals/wards, hospices, and schools for the handicapped (%)
People in Group quarters - Hospitals/wards and hospices for chronically ill (%)
People in Group quarters - Hospices or homes for chronically ill (%)
People in Group quarters - Military hospitals or wards for chronically ill (%)
People in Group quarters - Other hospitals or wards for chronically ill (%)
People in Group quarters - Hospitals or wards for drug/alcohol abuse (%)
People in Group quarters - Mental (Psychiatric) hospitals or wards (%)
People in Group quarters - Schools, hospitals, or wards for the mentally retarded (%)
People in Group quarters - Schools, hospitals, or wards for the physically handicapped (%)
People in Group quarters - Institutions for the deaf (%)
People in Group quarters - Institutions for the blind (%)
People in Group quarters - Orthopedic wards and institutions for the physically handicapped (%)
People in Group quarters - Wards in general hospitals for patients who have no usual home elsewhere (%)
People in Group quarters - Wards in military hospitals for patients who have no usual home elsewhere (%)
People in Group quarters - Juvenile institutions (%)
People in Group quarters - Long-term care (%)
People in Group quarters - Homes for abused, dependent, and neglected children (%)
People in Group quarters - Residential treatment centers for emotionally disturbed children (%)
People in Group quarters - Training schools for juvenile delinquents (%)
People in Group quarters - Short-term care, detention or diagnostic centers for delinquent children (%)
People in Group quarters - Type of juvenile institution unknown (%)
People in Group quarters - Noninstitutionalized population (%)
People in Group quarters - College dormitories (includes college quarters off campus) (%)
People in Group quarters - Military quarters (%)
People in Group quarters - On base (%)
People in Group quarters - Barracks, unaccompanied personnel housing (UPH), (Enlisted/Officer), ;and similar group living quarters for military personnel (%)
People in Group quarters - Transient quarters for temporary residents (%)
People in Group quarters - Military ships (%)
People in Group quarters - Group homes (%)
People in Group quarters - Homes or halfway houses for drug/alcohol abuse (%)
People in Group quarters - Homes for the mentally ill (%)
People in Group quarters - Homes for the mentally retarded (%)
People in Group quarters - Homes for the physically handicapped (%)
People in Group quarters - Other group homes (%)
People in Group quarters - Religious group quarters (%)
People in Group quarters - Dormitories (%)
People in Group quarters - Agriculture workers' dormitories on farms (%)
People in Group quarters - Job Corps and vocational training facilities (%)
People in Group quarters - Other workers' dormitories (%)
People in Group quarters - Crews of maritime vessels (%)
People in Group quarters - Other nonhousehold living situations (%)
People in Group quarters - Other noninstitutional group quarters (%)
Residents speaking English at home (%)
Residents speaking English at home - Born in the United States (%)
Residents speaking English at home - Native, born elsewhere (%)
Residents speaking English at home - Foreign born (%)
Residents speaking Spanish at home (%)
Residents speaking Spanish at home - Born in the United States (%)
Residents speaking Spanish at home - Native, born elsewhere (%)
Residents speaking Spanish at home - Foreign born (%)
Residents speaking other language at home (%)
Residents speaking other language at home - Born in the United States (%)
Residents speaking other language at home - Native, born elsewhere (%)
Residents speaking other language at home - Foreign born (%)
Class of Workers - Employee of private company (%)
Class of Workers - Self-employed in own incorporated business (%)
Class of Workers - Private not-for-profit wage and salary workers (%)
Class of Workers - Local government workers (%)
Class of Workers - State government workers (%)
Class of Workers - Federal government workers (%)
Class of Workers - Self-employed workers in own not incorporated business and Unpaid family workers (%)
House heating fuel used in houses and condos - Utility gas (%)
House heating fuel used in houses and condos - Bottled, tank, or LP gas (%)
House heating fuel used in houses and condos - Electricity (%)
House heating fuel used in houses and condos - Fuel oil, kerosene, etc. (%)
House heating fuel used in houses and condos - Coal or coke (%)
House heating fuel used in houses and condos - Wood (%)
House heating fuel used in houses and condos - Solar energy (%)
House heating fuel used in houses and condos - Other fuel (%)
House heating fuel used in houses and condos - No fuel used (%)
House heating fuel used in apartments - Utility gas (%)
House heating fuel used in apartments - Bottled, tank, or LP gas (%)
House heating fuel used in apartments - Electricity (%)
House heating fuel used in apartments - Fuel oil, kerosene, etc. (%)
House heating fuel used in apartments - Coal or coke (%)
House heating fuel used in apartments - Wood (%)
House heating fuel used in apartments - Solar energy (%)
House heating fuel used in apartments - Other fuel (%)
House heating fuel used in apartments - No fuel used (%)
Armed forces status - In Armed Forces (%)
Armed forces status - Civilian (%)
Armed forces status - Civilian - Veteran (%)
Armed forces status - Civilian - Nonveteran (%)
Fatal accidents locations in years 2005-2021
Fatal accidents locations in 2005
Fatal accidents locations in 2006
Fatal accidents locations in 2007
Fatal accidents locations in 2008
Fatal accidents locations in 2009
Fatal accidents locations in 2010
Fatal accidents locations in 2011
Fatal accidents locations in 2012
Fatal accidents locations in 2013
Fatal accidents locations in 2014
Fatal accidents locations in 2015
Fatal accidents locations in 2016
Fatal accidents locations in 2017
Fatal accidents locations in 2018
Fatal accidents locations in 2019
Fatal accidents locations in 2020
Fatal accidents locations in 2021
Alcohol use - People drinking some alcohol every month (%)
Alcohol use - People not drinking at all (%)
Alcohol use - Average days/month drinking alcohol
Alcohol use - Average drinks/week
Alcohol use - Average days/year people drink much
Audiometry - Average condition of hearing (%)
Audiometry - People that can hear a whisper from across a quiet room (%)
Audiometry - People that can hear normal voice from across a quiet room (%)
Audiometry - Ears ringing, roaring, buzzing (%)
Audiometry - Had a job exposure to loud noise (%)
Audiometry - Had off-work exposure to loud noise (%)
Blood Pressure & Cholesterol - Has high blood pressure (%)
Blood Pressure & Cholesterol - Checking blood pressure at home (%)
Blood Pressure & Cholesterol - Frequently checking blood cholesterol (%)
Blood Pressure & Cholesterol - Has high cholesterol level (%)
Consumer Behavior - Money monthly spent on food at supermarket/grocery store
Consumer Behavior - Money monthly spent on food at other stores
Consumer Behavior - Money monthly spent on eating out
Consumer Behavior - Money monthly spent on carryout/delivered foods
Consumer Behavior - Income spent on food at supermarket/grocery store (%)
Consumer Behavior - Income spent on food at other stores (%)
Consumer Behavior - Income spent on eating out (%)
Consumer Behavior - Income spent on carryout/delivered foods (%)
Current Health Status - General health condition (%)
Current Health Status - Blood donors (%)
Current Health Status - Has blood ever tested for HIV virus (%)
Current Health Status - Left-handed people (%)
Dermatology - People using sunscreen (%)
Diabetes - Diabetics (%)
Diabetes - Had a blood test for high blood sugar (%)
Diabetes - People taking insulin (%)
Diet Behavior & Nutrition - Diet health (%)
Diet Behavior & Nutrition - Milk product consumption (# of products/month)
Diet Behavior & Nutrition - Meals not home prepared (#/week)
Diet Behavior & Nutrition - Meals from fast food or pizza place (#/week)
Diet Behavior & Nutrition - Ready-to-eat foods (#/month)
Diet Behavior & Nutrition - Frozen meals/pizza (#/month)
Drug Use - People that ever used marijuana or hashish (%)
Drug Use - Ever used hard drugs (%)
Drug Use - Ever used any form of cocaine (%)
Drug Use - Ever used heroin (%)
Drug Use - Ever used methamphetamine (%)
Health Insurance - People covered by health insurance (%)
Kidney Conditions-Urology - Avg. # of times urinating at night
Medical Conditions - People with asthma (%)
Medical Conditions - People with anemia (%)
Medical Conditions - People with psoriasis (%)
Medical Conditions - People with overweight (%)
Medical Conditions - Elderly people having difficulties in thinking or remembering (%)
Medical Conditions - People who ever received blood transfusion (%)
Medical Conditions - People having trouble seeing even with glass/contacts (%)
Medical Conditions - People with arthritis (%)
Medical Conditions - People with gout (%)
Medical Conditions - People with congestive heart failure (%)
Medical Conditions - People with coronary heart disease (%)
Medical Conditions - People with angina pectoris (%)
Medical Conditions - People who ever had heart attack (%)
Medical Conditions - People who ever had stroke (%)
Medical Conditions - People with emphysema (%)
Medical Conditions - People with thyroid problem (%)
Medical Conditions - People with chronic bronchitis (%)
Medical Conditions - People with any liver condition (%)
Medical Conditions - People who ever had cancer or malignancy (%)
Mental Health - People who have little interest in doing things (%)
Mental Health - People feeling down, depressed, or hopeless (%)
Mental Health - People who have trouble sleeping or sleeping too much (%)
Mental Health - People feeling tired or having little energy (%)
Mental Health - People with poor appetite or overeating (%)
Mental Health - People feeling bad about themself (%)
Mental Health - People who have trouble concentrating on things (%)
Mental Health - People moving or speaking slowly or too fast (%)
Mental Health - People having thoughts they would be better off dead (%)
Oral Health - Average years since last visit a dentist
Oral Health - People embarrassed because of mouth (%)
Oral Health - People with gum disease (%)
Oral Health - General health of teeth and gums (%)
Oral Health - Average days a week using dental floss/device
Oral Health - Average days a week using mouthwash for dental problem
Oral Health - Average number of teeth
Pesticide Use - Households using pesticides to control insects (%)
Pesticide Use - Households using pesticides to kill weeds (%)
Physical Activity - People doing vigorous-intensity work activities (%)
Physical Activity - People doing moderate-intensity work activities (%)
Physical Activity - People walking or bicycling (%)
Physical Activity - People doing vigorous-intensity recreational activities (%)
Physical Activity - People doing moderate-intensity recreational activities (%)
Physical Activity - Average hours a day doing sedentary activities
Physical Activity - Average hours a day watching TV or videos
Physical Activity - Average hours a day using computer
Physical Functioning - People having limitations keeping them from working (%)
Physical Functioning - People limited in amount of work they can do (%)
Physical Functioning - People that need special equipment to walk (%)
Physical Functioning - People experiencing confusion/memory problems (%)
Physical Functioning - People requiring special healthcare equipment (%)
Prescription Medications - Average number of prescription medicines taking
Preventive Aspirin Use - Adults 40+ taking low-dose aspirin (%)
Reproductive Health - Vaginal deliveries (%)
Reproductive Health - Cesarean deliveries (%)
Reproductive Health - Deliveries resulted in a live birth (%)
Reproductive Health - Pregnancies resulted in a delivery (%)
Reproductive Health - Women breastfeeding newborns (%)
Reproductive Health - Women that had a hysterectomy (%)
Reproductive Health - Women that had both ovaries removed (%)
Reproductive Health - Women that have ever taken birth control pills (%)
Reproductive Health - Women taking birth control pills (%)
Reproductive Health - Women that have ever used Depo-Provera or injectables (%)
Reproductive Health - Women that have ever used female hormones (%)
Sexual Behavior - People 18+ that ever had sex (vaginal, anal, or oral) (%)
Sexual Behavior - Males 18+ that ever had vaginal sex with a woman (%)
Sexual Behavior - Males 18+ that ever performed oral sex on a woman (%)
Sexual Behavior - Males 18+ that ever had anal sex with a woman (%)
Sexual Behavior - Males 18+ that ever had any sex with a man (%)
Sexual Behavior - Females 18+ that ever had vaginal sex with a man (%)
Sexual Behavior - Females 18+ that ever performed oral sex on a man (%)
Sexual Behavior - Females 18+ that ever had anal sex with a man (%)
Sexual Behavior - Females 18+ that ever had any kind of sex with a woman (%)
Sexual Behavior - Average age people first had sex
Sexual Behavior - Average number of female sex partners in lifetime (males 18+)
Sexual Behavior - Average number of female vaginal sex partners in lifetime (males 18+)
Sexual Behavior - Average age people first performed oral sex on a woman (18+)
Sexual Behavior - Average number of woman performed oral sex on in lifetime (18+)
Sexual Behavior - Average number of male sex partners in lifetime (males 18+)
Sexual Behavior - Average number of male anal sex partners in lifetime (males 18+)
Sexual Behavior - Average age people first performed oral sex on a man (18+)
Sexual Behavior - Average number of male oral sex partners in lifetime (18+)
Sexual Behavior - People using protection when performing oral sex (%)
Sexual Behavior - Average number of times people have vaginal or anal sex a year
Sexual Behavior - People having sex without condom (%)
Sexual Behavior - Average number of male sex partners in lifetime (females 18+)
Sexual Behavior - Average number of male vaginal sex partners in lifetime (females 18+)
Sexual Behavior - Average number of female sex partners in lifetime (females 18+)
Sexual Behavior - Circumcised males 18+ (%)
Sleep Disorders - Average hours sleeping at night
Sleep Disorders - People that has trouble sleeping (%)
Smoking-Cigarette Use - People smoking cigarettes (%)
Taste & Smell - People 40+ having problems with smell (%)
Taste & Smell - People 40+ having problems with taste (%)
Taste & Smell - People 40+ that ever had wisdom teeth removed (%)
Taste & Smell - People 40+ that ever had tonsils teeth removed (%)
Taste & Smell - People 40+ that ever had a loss of consciousness because of a head injury (%)
Taste & Smell - People 40+ that ever had a broken nose or other serious injury to face or skull (%)
Taste & Smell - People 40+ that ever had two or more sinus infections (%)
Weight - Average height (inches)
Weight - Average weight (pounds)
Weight - Average BMI
Weight - People that are obese (%)
Weight - People that ever were obese (%)
Weight - People trying to lose weight (%)
Urban population: 88,956
Rural population: 540
Estimated median house/condo value in 2022: $163,157
75217:
$163,157Texas:
$275,400
Median resident age: This zip code:
28.0 yearsTexas median age:
35.6 years
Average household size: This zip code:
3.5 peopleTexas:
2.6 people
Averages for the 2020 tax year for zip code 75217, filed in 2021:
Average Adjusted Gross Income (AGI) in 2020: $32,009 (Individual Income Tax Returns) Here:
$32,009State:
$77,054
Salary/wage: $32,049 (reported on 82.6% of returns )Here:
$32,049State:
$62,766
(% of AGI for various income ranges: 1255.6% for AGIs below $25k , 3846.0% for AGIs $25k-50k , 6945.3% for AGIs $50k-75k , 10066.5% for AGIs $75k-100k , 14455.8% for AGIs $100k-200k ) Taxable interest for individuals: $401 (reported on 5.4% of returns )This zip code:
$401Texas:
$2,665
(% of AGI for various income ranges: 1.6% for AGIs below $25k , 2.0% for AGIs $25k-50k , 5.3% for AGIs $50k-75k , 5.8% for AGIs $75k-100k , 29.8% for AGIs $100k-200k ) Ordinary dividends: $990 (reported on 1.4% of returns )(% of AGI for various income ranges: 0.6% for AGIs below $25k , 0.9% for AGIs $25k-50k , 2.8% for AGIs $50k-75k , 5.2% for AGIs $75k-100k , 39.1% for AGIs $100k-200k ) Net capital gain/loss in AGI: +$4,132 (reported on 1.6% of returns )Here:
+$4,132State:
+$39,590
(% of AGI for various income ranges: 0.7% for AGIs below $25k , 2.7% for AGIs $25k-50k , 12.5% for AGIs $50k-75k , 13.7% for AGIs $75k-100k , 334.0% for AGIs $100k-200k ) Profit/loss from business: +$8,803 (reported on 26.9% of returns )Here:
+$8,803State:
+$10,888
(% of AGI for various income ranges: 322.3% for AGIs below $25k , 259.3% for AGIs $25k-50k , 252.7% for AGIs $50k-75k , 423.1% for AGIs $75k-100k , 1148.8% for AGIs $100k-200k ) Taxable individual retirement arrangement distribution: $11,594 (reported on 1.5% of returns )75217:
$11,594Texas:
$24,740
(% of AGI for various income ranges: 9.4% for AGIs below $25k , 16.4% for AGIs $25k-50k , 33.7% for AGIs $50k-75k , 75.6% for AGIs $75k-100k , 357.2% for AGIs $100k-200k ) Total itemized deductions: $28,588 (reported on 1.7% of returns )Here:
$28,588State:
$40,428
(% of AGI for various income ranges: 8.0% for AGIs below $25k , 58.6% for AGIs $25k-50k , 131.9% for AGIs $50k-75k , 230.1% for AGIs $75k-100k , 827.7% for AGIs $100k-200k ) Charity contributions: $9,996 (reported on 1.3% of returns )(% of AGI for various income ranges: 1.3% for AGIs below $25k , 15.2% for AGIs $25k-50k , 38.1% for AGIs $50k-75k , 67.6% for AGIs $75k-100k , 246.7% for AGIs $100k-200k ) Taxes paid: $5,032 (reported on 1.6% of returns )(% of AGI for various income ranges: 1.6% for AGIs below $25k , 10.2% for AGIs $25k-50k , 24.8% for AGIs $50k-75k , 37.3% for AGIs $75k-100k , 91.6% for AGIs $100k-200k ) Earned income credit: $2,903 (reported on 32.8% of returns )(% of AGI for various income ranges: 184.1% for AGIs below $25k , 104.7% for AGIs $25k-50k , 1.9% for AGIs $50k-75k ) Percentage of individuals using paid preparers for their 2020 taxes: 86.7%(% for various income ranges: 85.5% for AGIs below $25k , 88.2% for AGIs $25k-50k , 86.9% for AGIs $50k-75k , 86.8% for AGIs $75k-100k , 89.4% for AGIs $100k-200k , 100.0% for AGIs over 200k )
Averages for the 2012 tax year for zip code 75217, filed in 2013:
Average Adjusted Gross Income (AGI) in 2012: $26,064 (Individual Income Tax Returns) Here:
$26,064State:
$65,384
Salary/wage: $25,684 (reported on 86.1% of returns )Here:
$25,684State:
$52,524
(% of AGI for various income ranges: 78.6% for AGIs below $25k , 90.8% for AGIs $25k-50k , 88.1% for AGIs $50k-75k , 81.6% for AGIs $75k-100k , 61.9% for AGIs $100k-200k ) Taxable interest for individuals: $606 (reported on 6.0% of returns )This zip code:
$606Texas:
$2,372
(% of AGI for various income ranges: 0.1% for AGIs below $25k , 0.2% for AGIs $50k-75k , 0.2% for AGIs $75k-100k , 0.4% for AGIs $100k-200k ) Ordinary dividends: $4,250 (reported on 1.9% of returns )(% of AGI for various income ranges: 0.4% for AGIs below $25k , 0.3% for AGIs $25k-50k , 0.3% for AGIs $50k-75k , 0.4% for AGIs $100k-200k ) Net capital gain/loss in AGI: +$1,672 (reported on 1.0% of returns )Here:
+$1,672State:
+$35,319
(% of AGI for various income ranges: 0.1% for AGIs $50k-75k , 0.4% for AGIs $75k-100k ) Profit/loss from business: +$8,093 (reported on 22.2% of returns )Here:
+$8,093State:
+$13,732
(% of AGI for various income ranges: 16.3% for AGIs below $25k , 3.1% for AGIs $25k-50k , 1.7% for AGIs $50k-75k , 1.6% for AGIs $75k-100k , 3.4% for AGIs $100k-200k ) Taxable individual retirement arrangement distribution: $11,009 (reported on 2.2% of returns )75217:
$11,009Texas:
$19,511
(% of AGI for various income ranges: 0.5% for AGIs below $25k , 0.6% for AGIs $25k-50k , 1.3% for AGIs $50k-75k , 2.3% for AGIs $75k-100k , 3.3% for AGIs $100k-200k ) Total itemized deductions: $16,183 (35% of AGI, reported on 7.7% of returns )Here:
$16,183State:
$24,724
Here:
34.9% of AGIState:
15.9% of AGI
(% of AGI for various income ranges: 2.3% for AGIs below $25k , 5.1% for AGIs $25k-50k , 7.5% for AGIs $50k-75k , 7.1% for AGIs $75k-100k , 6.9% for AGIs $100k-200k ) Charity contributions: $4,345 (reported on 5.7% of returns )(% of AGI for various income ranges: 0.3% for AGIs below $25k , 0.9% for AGIs $25k-50k , 1.6% for AGIs $50k-75k , 2.0% for AGIs $75k-100k , 2.3% for AGIs $100k-200k ) Taxes paid: $2,630 (reported on 7.4% of returns )(% of AGI for various income ranges: 0.3% for AGIs below $25k , 0.8% for AGIs $25k-50k , 1.1% for AGIs $50k-75k , 1.3% for AGIs $75k-100k , 1.4% for AGIs $100k-200k ) Earned income credit: $2,921 (reported on 41.3% of returns )(% of AGI for various income ranges: 12.1% for AGIs below $25k , 2.1% for AGIs $25k-50k ) Percentage of individuals using paid preparers for their 2012 taxes: 65.4%(% for various income ranges: 65.7% for AGIs below $25k , 64.7% for AGIs $25k-50k , 65.7% for AGIs $50k-75k , 62.3% for AGIs $75k-100k , 70.8% for AGIs $100k-200k )
Averages for the 2004 tax year for zip code 75217, filed in 2005:
Average Adjusted Gross Income (AGI) in 2004: $24,155 (Individual Income Tax Returns) Here:
$24,155State:
$47,881
Salary/wage: $24,089 (reported on 89.3% of returns )Here:
$24,089State:
$41,947
(% of AGI for various income ranges: 84.7% for AGIs below $10k , 87.5% for AGIs $10k-25k , 93.2% for AGIs $25k-50k , 88.2% for AGIs $50k-75k , 86.3% for AGIs $75k-100k , 57.8% for AGIs over 100k ) Taxable interest for individuals: $801 (reported on 11.0% of returns )This zip code:
$801Texas:
$2,255
(% of AGI for various income ranges: 0.6% for AGIs below $10k , 0.4% for AGIs $10k-25k , 0.2% for AGIs $25k-50k , 0.5% for AGIs $50k-75k , 0.4% for AGIs $75k-100k , 1.3% for AGIs over 100k ) Taxable dividends: $741 (reported on 2.7% of returns )(% of AGI for various income ranges: 0.2% for AGIs below $10k , 0.1% for AGIs $10k-25k , 0.1% for AGIs $25k-50k , 0.1% for AGIs $50k-75k , 0.1% for AGIs $75k-100k , 0.2% for AGIs over 100k ) Net capital gain/loss: +$1,485 (reported on 1.9% of returns )Here:
+$1,485State:
+$16,110
(% of AGI for various income ranges: -0.2% for AGIs below $10k , 0.0% for AGIs $10k-25k , 0.1% for AGIs $25k-50k , 0.3% for AGIs $50k-75k , 0.2% for AGIs $75k-100k , 0.4% for AGIs over 100k ) Profit/loss from business: +$6,546 (reported on 14.7% of returns )Here:
+$6,546State:
+$11,013
(% of AGI for various income ranges: 13.3% for AGIs below $10k , 7.4% for AGIs $10k-25k , 1.8% for AGIs $25k-50k , 1.5% for AGIs $50k-75k , 2.0% for AGIs $75k-100k , 6.5% for AGIs over 100k ) IRA payment deduction: $1,728 (reported on 0.7% of returns )(% of AGI for various income ranges: 0.1% for AGIs $10k-25k , 0.1% for AGIs $25k-50k , 0.0% for AGIs $50k-75k , 0.1% for AGIs $75k-100k ) Total itemized deductions: $14,031 (33% of AGI, reported on 10.6% of returns )Here:
$14,031State:
$19,631
Here:
32.6% of AGIState:
18.9% of AGI
(% of AGI for various income ranges: 2.4% for AGIs below $10k , 3.2% for AGIs $10k-25k , 6.9% for AGIs $25k-50k , 8.2% for AGIs $50k-75k , 8.2% for AGIs $75k-100k , 14.1% for AGIs over 100k ) Charity contributions deductions: $4,014 (9% of AGI, reported on 8.6% of returns )Here:
9.0% of AGIState:
4.2% of AGI
(% of AGI for various income ranges: 0.3% for AGIs below $10k , 0.6% for AGIs $10k-25k , 1.5% for AGIs $25k-50k , 2.2% for AGIs $50k-75k , 3.0% for AGIs $75k-100k , 4.1% for AGIs over 100k ) Total tax: $2,381 (reported on 51.4% of returns )(% of AGI for various income ranges: 3.2% for AGIs below $10k , 2.8% for AGIs $10k-25k , 4.3% for AGIs $25k-50k , 7.9% for AGIs $50k-75k , 10.7% for AGIs $75k-100k , 17.2% for AGIs over 100k ) Earned income credit: $2,119 (reported on 40.8% of returns )Percentage of individuals using paid preparers for their 2004 taxes: 67.9%(% for various income ranges: 60.4% for AGIs below $10k , 73.7% for AGIs $10k-25k , 67.3% for AGIs $25k-50k , 64.1% for AGIs $50k-75k , 56.7% for AGIs $75k-100k , 66.4% for AGIs over 100k )
Estimated median household income in 2022: This zip code:
$49,328Texas:
$72,284
Nearest zip codes: 75227 ,
75180 ,
75141 ,
75253 ,
75149 ,
75215 .
Dallas Zip Code Map
Percentage of family households: This zip code:
66.1%Texas:
50.5%
Percentage of households with unmarried partners: This zip code:
4.0%Texas:
48.7%
Likely homosexual households (counted as self-reported same-sex unmarried-partner households)
Lesbian couples: 0.0% of all households Gay men: 0.0% of all households
Household received Food Stamps/SNAP in the past 12 months: 5,456Household did not receive Food Stamps/SNAP in the past 12 months: 19,885
Women who had a birth in the past 12 months: 1,381 (837 now married , 536 unmarried) Women who did not have a birth in the past 12 months: 21,758 (9,847 now married , 11,901 unmarried)
Housing units in zip code 75217 with a mortgage: 6,842 (209
second mortgage , 12
home equity loan , 163
both second mortgage and home equity loan )
Houses without a mortgage: 94
Median monthly owner costs for units with a mortgage: $1,268
Median monthly owner costs for units without a mortgage: $523
Residents with income below the poverty level in 2022:
This zip code:
26.6%Whole state:
14.0%
Residents with income below 50% of the poverty level in 2022:
This zip code:
15.4%Whole state:
7.4%
Median number of rooms in houses and condos: Median number of rooms in apartments: Notable locations in this zip code not listed on our city pages
Click to draw/clear zip code borders Notable locations in zip code 75217: (A) , Dallas Fire - Rescue Station 5 (B) , Dallas Fire - Rescue Station 51 (C) , Dallas Fire - Rescue Station 34 (D) . Display/hide their locations on the map
Churches in zip code 75217 include: (A) , Sandyland Church (B) , Day Spring Pentecostal Church (C) , Dallas Pentecostal Church (D) , Iglesia Hispana Bethal Church (E) , Templo la Hermosa Church (F) , Sandyland Church (G) , New Life Fellowship Church (H) , Solid Rock Missionary Baptist Church (I) . Display/hide their locations on the map
Cemeteries: (1) , Lincoln Memorial Park (2) , Samuell-Crawford Memorial Park (3) . Display/hide their locations on the map
Reservoirs: (A) , Lake June (B) . Display/hide their locations on the map
Creeks: (A) , Prairie Creek (B) , Elam Creek (C) , Fivemile Creek (D) . Display/hide their locations on the map
Parks in zip code 75217 include: (1) , Holcomb Park (2) , Samuel - Elam Park (3) , Rylie Park (4) , Saint Augustine Park (5) , Roosevelt Park (6) , Pemberton Hill Park (7) , Woodland Springs Park (8) , Umphress Park (9) . Display/hide their locations on the map
Tourist attractions (not listed on the city page) : (1) , Be Real Entertainment (Arcades & Amusements; 6606 S Loop 12) (2) . Display/hide their approximate locations on the map
Year house built (houses)
100 2020 or later796 2010 to 20192,011 2000 to 20091,476 1990 to 19992,887 1980 to 19893,877 1970 to 19793,602 1960 to 19698,493 1950 to 19591,149 1940 to 1949288 1939 or earlier
Owner-occupied Renter-occupied
Cars and other vehicles available in Dallas, TX (75217) in owner-occupied houses/condos
393 no vehicle 2,828 1 vehicle 5,434 2 vehicles 3,126 3 vehicles 2,094 4 vehicles 833 5+ vehicles
Cars and other vehicles available in Dallas, TX (75217) in renter-occupied apartments
1,744 no vehicle 3,625 1 vehicle 3,007 2 vehicles 1,522 3 vehicles 308 4 vehicles 224 5+ vehicles
Zip code 75217 household income distribution in 2022 2,171 Less than $10,0001,183 $10,000 to $14,9991,275 $15,000 to $19,9991,525 $20,000 to $24,9991,090 $25,000 to $29,9991,675 $30,000 to $34,9991,154 $35,000 to $39,9991,042 $40,000 to $44,9991,574 $45,000 to $49,9992,265 $50,000 to $59,9992,965 $60,000 to $74,9993,329 $75,000 to $99,9992,150 $100,000 to $124,999657 $125,000 to $149,999779 $150,000 to $199,999483 $200,000 or moreEstimate of home value of owner-occupied houses/condos in 2022 in zip code 75217 268 Less than $10,000169 $10,000 to $14,99963 $15,000 to $19,99990 $20,000 to $24,99930 $25,000 to $29,99941 $30,000 to $34,999104 $40,000 to $49,999406 $50,000 to $59,999363 $60,000 to $69,999514 $70,000 to $79,999983 $80,000 to $89,999693 $90,000 to $99,9991,282 $100,000 to $124,9991,239 $125,000 to $149,9992,268 $150,000 to $174,9991,156 $175,000 to $199,9991,327 $200,000 to $249,999765 $250,000 to $299,999323 $300,000 to $399,999141 $400,000 to $499,99951 $500,000 to $749,99946 $750,000 to $999,9998 $1,000,000 to $1,499,999Rent paid by renters in 2022 in zip code 75217 176 Less than $100167 $100 to $14986 $150 to $199155 $200 to $24978 $250 to $299128 $300 to $349121 $350 to $399285 $400 to $44990 $450 to $499280 $500 to $549295 $550 to $599104 $600 to $649338 $650 to $699396 $700 to $749324 $750 to $799807 $800 to $8991,976 $900 to $9992,134 $1,000 to $1,2491,108 $1,250 to $1,499410 $1,500 to $1,99930 $2,000 to $2,499443 No cash rent
Median gross rent in 2022: $1,149.
Median price asked for vacant for-sale houses and condos in 2022: $273,353.
Estimated median house (or condo) value in 2022 for: White Non-Hispanic householders: $149,244Black or African American householders: $179,599American Indian or Alaska Native householders: $219,756Asian householders: $296,908Some other race householders: $159,362Two or more races householders: $152,090Hispanic or Latino householders: $159,046Estimated median house or condo value in 2022: $163,157
75217:
$163,157Texas:
$275,400
Lower value quartile - upper value quartile: $108,452 - $208,491
Mean price in 2022: Detached houses: $168,022Here:
$168,022State:
$369,058
Townhouses or other attached units: $215,849Here:
$215,849State:
$327,631
Mobile homes: $75,378Here:
$75,378State:
$124,413
Housing units in structures:
One, detached: 20,246One, attached: 458Two: 963 or 4: 4705 to 9: 1,84410 to 19: 1,37720 to 49: 49850 or more: 477Mobile homes: 817Unemployment : 3.3%
Means of transportation to work in zip code 75217 75.7% 26,118 Drove a car alone15.4% 5,325 Carpooled0.9% 317 Bus or trolley bus0.2% 64 Streetcar or trolley car0.1% 48 Subway or elevated0.2% 59 Railroad0.1% 49 Walked1.5% 507 Other means2.6% 913 Worked at homeTravel time to work (commute) in zip code 75217 116 Less than 5 minutes848 5 to 9 minutes2,245 10 to 14 minutes3,592 15 to 19 minutes3,953 20 to 24 minutes1,564 25 to 29 minutes6,989 30 to 34 minutes1,384 35 to 39 minutes2,341 40 to 44 minutes4,528 45 to 59 minutes3,595 60 to 89 minutes1,316 90 or more minutes
Percentage of zip code residents living and working in this county: 90.8%
Household type by relationship:
Households: 89,497
Male householders: 12,276 (1,751 living alone ), Female householders: 12,956 (2,229 living alone )13,141 spouses (13,055 opposite-sex spouses ), 993 unmarried partners , (925 opposite-sex unmarried partners ), 36,657 children (35,465 natural , 228 adopted , 951 stepchildren ), 4,509 grandchildren , 1,815 brothers or sisters , 1,402 parents , 10 foster children , 3,344 other relatives , 1,677 non-relatives In group quarters: 30 (-1 institutionalized population )
Size of family households: 4,919 2-persons , 3,743 3-persons , 4,634 4-persons , 4,143 5-persons , 1,547 6-persons , 1,255 7-or-more-persons
Size of nonfamily households: 3,979 1-person , 568 2-persons , 102 3-persons , 29 4-persons , 4 6-persons
16,219 married couples with children. single-parent households (2,069 men , 7,239 women ).
30.4% of residents of 75217 zip code speak English at home. of residents speak Spanish at home (62% very well, 11% well, 17% not well, 9% not at all ).of residents speak other Indo-European language at home (100% very well ).of residents speak Asian or Pacific Island language at home (40% very well, 34% well, 22% not well, 5% not at all ).of residents speak other language at home (71% very well, 19% well, 10% not at all ).
Foreign born population: 28,130 (31.4%)
(23.5%
of them are naturalized citizens )
This zip code:
31.4%Whole state:
17.2%
81% Honduras 6% Costa Rica 4% El Salvador 3% Guatemala 1% Mexico 0% Barbados 0% Dominica 2% American 0% German 0% English 0% Scottish 0% European 0% Jamaican 0% African
Year of entry for the foreign-born population
6,408 2010 or later 7,956 2000 to 2009 8,192 1990 to 1999 6,073 Before 1990
There are
90 Medical Specialists in Zip Code 75217 .
Facilities with environmental interests located in this zip code:
B H MACON EL (650 HOLCOMB RD in DALLAS, TX)
(National Center for Education Statistics) - STATE ID-057905180 Organizations: DALLAS ISD (SCHOOL DISTRICT)
AMERICAN ENVIRONMENTAL EQUIPMENT (8815 C F HAWN FWY in DALLAS, TX)
(Resource Conservation and Recovery Act (tracking hazardous waste)) Alternative names: AMERICAN ENVIRONMENTAL EQUIP SVCS
A1 AUTO SALVAGE (1015 CLEARFIELD RD in DALLAS, TX)
National Pollutant Discharge Elimination System NON-MAJOR (Tracking pollutant discharge elimination systems) - permit Business SIC classification: MOTOR VEHICLE PARTS, USED
Housing units lacking complete plumbing facilities: 1.5%
Housing units lacking complete kitchen facilities: 1.2%
51.5% Electricity 46.5% Utility gas 0.9% Bottled, tank, or LP gas 0.9% No fuel used
Population in 1990: 57,605. Population change in the 1990s: +15,292 (+26.5%).
Place of birth for U.S.-born residents:
This state: 53,701Northeast: 175Midwest: 1,141South: 3,000West: 1,814
60% of the 75217 zip code residents lived in the same house 5 years ago.
Out of people who lived in different houses, 84% lived in this county.
Out of people who lived in different counties, 50% lived in Texas.
95% of the 75217 zip code residents lived in the same house 1 year ago.
Out of people who lived in different houses, 72% moved from this county.
Out of people who lived in different houses, 17% moved from different county within same state.
Out of people who lived in different houses, 9% moved from different state.
Out of people who lived in different houses, 4% moved from abroad.
Private vs. public school enrollment:
Students in private schools in grades 1 to 8 (elementary and middle school): 355
Students in private schools in grades 9 to 12 (high school): 178
Students in private undergraduate colleges: 248
Occupation by median earnings in the past 12 months ($)
86,825 Legal occupations 83,129 Life, physical, and social science occupations 71,996 Architecture and engineering occupations 71,505 Health diagnosing and treating practitioners and other technical occupations 51,407 Business and financial operations occupations 46,506 Management occupations
Companies with federal contracts located in this zip code (DALLAS, TX):
DALLAS SPRAY EQUIPMENT SALES & (7230 C F HAWN FWY; small business) in 5 contracts from 2000 to 2005
Contracts for Miscellaneous Maintenance and Repair Shop Specialized Equipment, Construction of Structures and Facilities -- Maintenance Buildings, Paints, Dopes, Varnishes, and Related Products, Miscellaneous Special Industry Machinery by ArmySigned by year: 2000: $102,580; 2001: $0; 2002: $0; 2003: $0; 2004: $7,893; 2005: $57,556; 2006: $0.
Biggest contracts: with Army for Miscellaneous Maintenance and Repair Shop Specialized Equipment. Signed on 2000-09-21. Completion date: 2000-11-30.
, same as above. Signed on 2005-07-27. Completion date: 2005-08-10.
with Army for Construction of Structures and Facilities -- Maintenance Buildings. Signed on 2000-08-15. Completion date: 2000-10-31.
with Army for Paints, Dopes, Varnishes, and Related Products. Signed on 2004-05-06. Completion date: 2004-05-28.
MMR ENTERPRISES, INC (10518 C F HAWN FWY; small business)
$12,040 with Army for Plumbing Fixtures and Accessories. Signed on 2006-02-02. Completion date: 2006-02-07.
GROCO PAINT MANUFACTURING COM (10818 C F HAWN; small business)
$4,541 with Army for Paints, Dopes, Varnishes, and Related Products. Signed on 2004-03-11. Completion date: 2004-03-26.
HERO ORINGS PACKAG & SEALS (1858 RIVERWAY DR; small business)
$2,860 with Defense Logistics Agency for Packing and Gasket Materials. Signed on 2005-03-12. Completion date: 2005-05-12.
Top industries in this zip code by the number of employees in 2005:
Management of Companies and Enterprises: Corporate, Subsidiary, and Regional Managing Offices (500-999 employees: 1 establishment, 1-4 employees: 1 establishment)Accommodation and Food Services: Limited-Service Restaurants (50-99: 1, 20-49: 7, 10-19: 7, 5-9: 4, 1-4: 5)Educational Services: Elementary and Secondary Schools (50-99: 2, 20-49: 2)Wholesale Trade: Other Miscellaneous Durable Goods Merchant Wholesalers (100-249: 1)
People in group quarters in 2010:
12 people in emergency and transitional shelters (with sleeping facilities) for people experiencing homelessness
People in group quarters in 2000:
1,984 people in other types of correctional institutions
89 people in training schools for juvenile delinquents
53 people in homes or halfway houses for drug/alcohol abuse
14 people in nursing homes
14 people in other noninstitutional group quarters
3 people in religious group quarters
Fatal accident statistics in 2014:
Fatal accident count: 5Vehicles involved in fatal accidents: 5Fatal accidents caused by drunken drivers: 2Fatalities: 5Persons involved in fatal accidents: 15Pedestrians involved in fatal accidents: 2
Fatal accident statistics in 2013:
Fatal accident count: 11Vehicles involved in fatal accidents: 14Fatal accidents caused by drunken drivers: 5Fatalities: 15Persons involved in fatal accidents: 30Pedestrians involved in fatal accidents: 4
Home Mortgage Disclosure Act Aggregated Statistics For Year 2009(Based on 17 full and 14 partial tracts) A) FHA, FSA/RHS & VA B) Conventional C) Refinancings D) Home Improvement Loans E) Loans on Dwellings For 5+ Families F) Non-occupant Loans on G) Loans On Manufactured Number Average Value Number Average Value Number Average Value Number Average Value Number Average Value Number Average Value Number Average Value
LOANS ORIGINATED 222 $85,604 206 $59,246 182 $77,572 29 $18,690 0 $0 171 $56,297 1 $34,570 APPLICATIONS APPROVED, NOT ACCEPTED 19 $103,320 8 $78,134 43 $61,993 13 $22,042 0 $0 4 $53,382 1 $154,060 APPLICATIONS DENIED 72 $78,612 91 $60,431 252 $68,728 187 $26,130 0 $0 62 $47,456 20 $41,818 APPLICATIONS WITHDRAWN 34 $87,771 32 $75,437 83 $79,093 21 $36,796 1 $5,029,680 33 $76,625 0 $0 FILES CLOSED FOR INCOMPLETENESS 15 $82,670 10 $60,647 28 $71,450 9 $29,869 0 $0 5 $53,500 0 $0
Aggregated Statistics For Year 2008(Based on 17 full and 14 partial tracts) A) FHA, FSA/RHS & VA B) Conventional C) Refinancings D) Home Improvement Loans E) Loans on Dwellings For 5+ Families F) Non-occupant Loans on G) Loans On Manufactured Number Average Value Number Average Value Number Average Value Number Average Value Number Average Value Number Average Value Number Average Value
LOANS ORIGINATED 285 $94,437 371 $71,751 272 $66,093 90 $31,260 3 $5,260,000 273 $59,183 8 $41,731 APPLICATIONS APPROVED, NOT ACCEPTED 35 $103,791 36 $71,432 76 $56,138 20 $37,957 2 $206,625 30 $61,569 0 $0 APPLICATIONS DENIED 123 $98,407 171 $71,895 720 $71,352 349 $32,741 0 $0 138 $58,733 17 $75,547 APPLICATIONS WITHDRAWN 77 $95,946 45 $71,520 159 $75,538 31 $32,085 1 $6,935,660 41 $64,839 0 $0 FILES CLOSED FOR INCOMPLETENESS 20 $89,664 37 $79,933 46 $72,929 9 $72,449 0 $0 12 $73,322 0 $0
Aggregated Statistics For Year 2007(Based on 17 full and 14 partial tracts) A) FHA, FSA/RHS & VA B) Conventional C) Refinancings D) Home Improvement Loans E) Loans on Dwellings For 5+ Families F) Non-occupant Loans on G) Loans On Manufactured Number Average Value Number Average Value Number Average Value Number Average Value Number Average Value Number Average Value Number Average Value
LOANS ORIGINATED 222 $100,634 916 $73,980 546 $66,094 241 $36,529 9 $825,894 433 $61,915 5 $35,408 APPLICATIONS APPROVED, NOT ACCEPTED 18 $90,017 164 $78,645 181 $68,206 44 $27,238 0 $0 71 $76,356 4 $56,035 APPLICATIONS DENIED 93 $103,582 505 $81,447 1,431 $76,798 558 $33,357 2 $178,680 316 $66,935 22 $46,555 APPLICATIONS WITHDRAWN 36 $104,514 156 $88,380 483 $78,581 39 $37,448 1 $8,179,850 64 $73,098 2 $84,240 FILES CLOSED FOR INCOMPLETENESS 10 $123,974 107 $81,327 127 $80,111 12 $40,098 1 $2,300,000 29 $71,214 0 $0
Aggregated Statistics For Year 2006(Based on 17 full and 14 partial tracts) A) FHA, FSA/RHS & VA B) Conventional C) Refinancings D) Home Improvement Loans E) Loans on Dwellings For 5+ Families F) Non-occupant Loans on G) Loans On Manufactured Number Average Value Number Average Value Number Average Value Number Average Value Number Average Value Number Average Value Number Average Value
LOANS ORIGINATED 239 $90,511 1,533 $65,438 796 $64,730 211 $39,653 2 $2,411,280 545 $56,353 2 $46,340 APPLICATIONS APPROVED, NOT ACCEPTED 10 $82,937 328 $68,200 250 $69,542 56 $24,980 0 $0 115 $66,650 7 $44,163 APPLICATIONS DENIED 98 $105,355 850 $66,216 1,325 $71,939 534 $32,411 0 $0 374 $59,460 11 $36,722 APPLICATIONS WITHDRAWN 51 $104,274 299 $73,539 756 $79,275 42 $45,404 0 $0 103 $62,400 3 $119,637 FILES CLOSED FOR INCOMPLETENESS 0 $0 80 $71,742 203 $81,768 6 $53,238 0 $0 24 $51,059 0 $0
Aggregated Statistics For Year 2005(Based on 17 full and 14 partial tracts) A) FHA, FSA/RHS & VA B) Conventional C) Refinancings D) Home Improvement Loans E) Loans on Dwellings For 5+ Families F) Non-occupant Loans on G) Loans On Manufactured Number Average Value Number Average Value Number Average Value Number Average Value Number Average Value Number Average Value Number Average Value
LOANS ORIGINATED 274 $89,095 1,496 $61,571 1,228 $66,330 218 $73,175 4 $2,392,050 577 $62,188 6 $33,020 APPLICATIONS APPROVED, NOT ACCEPTED 12 $81,385 319 $62,254 269 $65,297 52 $31,593 0 $0 117 $61,187 7 $51,019 APPLICATIONS DENIED 102 $107,226 957 $64,669 1,587 $64,442 452 $34,246 1 $1,505,400 356 $53,724 25 $48,221 APPLICATIONS WITHDRAWN 54 $104,402 342 $78,854 947 $82,917 178 $139,971 1 $377,350 136 $78,940 3 $17,053 FILES CLOSED FOR INCOMPLETENESS 12 $94,295 91 $74,375 304 $78,056 8 $44,632 0 $0 45 $63,946 0 $0
Aggregated Statistics For Year 2004(Based on 17 full and 14 partial tracts) A) FHA, FSA/RHS & VA B) Conventional C) Refinancings D) Home Improvement Loans E) Loans on Dwellings For 5+ Families F) Non-occupant Loans on G) Loans On Manufactured Number Average Value Number Average Value Number Average Value Number Average Value Number Average Value Number Average Value Number Average Value
LOANS ORIGINATED 452 $85,274 1,160 $66,906 1,442 $62,536 192 $36,420 2 $2,496,170 442 $62,346 5 $64,834 APPLICATIONS APPROVED, NOT ACCEPTED 27 $77,751 308 $69,610 325 $60,203 49 $39,368 0 $0 83 $70,268 3 $43,857 APPLICATIONS DENIED 169 $103,974 610 $71,829 1,840 $60,307 456 $30,663 0 $0 288 $55,360 24 $48,202 APPLICATIONS WITHDRAWN 107 $102,374 163 $68,183 871 $64,411 36 $48,718 0 $0 49 $62,720 3 $56,100 FILES CLOSED FOR INCOMPLETENESS 19 $92,085 102 $70,987 362 $70,205 7 $53,023 0 $0 15 $63,156 0 $0
Aggregated Statistics For Year 2003(Based on 17 full and 14 partial tracts) A) FHA, FSA/RHS & VA B) Conventional C) Refinancings D) Home Improvement Loans E) Loans on Dwellings For 5+ Families F) Non-occupant Loans on Number Average Value Number Average Value Number Average Value Number Average Value Number Average Value Number Average Value
LOANS ORIGINATED 495 $83,739 664 $65,356 1,809 $57,711 91 $27,524 3 $1,291,070 360 $54,080 APPLICATIONS APPROVED, NOT ACCEPTED 19 $68,714 182 $56,549 320 $56,181 41 $35,369 0 $0 72 $56,391 APPLICATIONS DENIED 69 $81,554 360 $59,964 1,819 $59,254 262 $21,002 0 $0 154 $53,677 APPLICATIONS WITHDRAWN 87 $83,450 126 $73,559 875 $60,560 7 $23,663 0 $0 67 $56,768 FILES CLOSED FOR INCOMPLETENESS 21 $71,526 72 $75,201 124 $52,966 3 $44,687 0 $0 19 $54,593
Aggregated Statistics For Year 2002(Based on 11 full and 10 partial tracts) A) FHA, FSA/RHS & VA B) Conventional C) Refinancings D) Home Improvement Loans E) Loans on Dwellings For 5+ Families F) Non-occupant Loans on Number Average Value Number Average Value Number Average Value Number Average Value Number Average Value Number Average Value
LOANS ORIGINATED 426 $74,420 312 $57,700 835 $52,113 78 $20,250 5 $1,980,252 200 $50,249 APPLICATIONS APPROVED, NOT ACCEPTED 21 $70,944 77 $54,366 178 $45,280 28 $32,208 0 $0 29 $38,556 APPLICATIONS DENIED 104 $71,878 226 $51,187 756 $51,026 176 $14,104 0 $0 96 $42,716 APPLICATIONS WITHDRAWN 40 $83,073 58 $58,152 533 $54,792 12 $28,517 0 $0 23 $40,771 FILES CLOSED FOR INCOMPLETENESS 22 $64,440 62 $52,819 86 $58,296 0 $0 1 $2,759,900 14 $45,851
Aggregated Statistics For Year 2001(Based on 11 full and 10 partial tracts) A) FHA, FSA/RHS & VA B) Conventional C) Refinancings D) Home Improvement Loans E) Loans on Dwellings For 5+ Families F) Non-occupant Loans on Number Average Value Number Average Value Number Average Value Number Average Value Number Average Value Number Average Value
LOANS ORIGINATED 430 $67,615 284 $52,730 576 $45,309 127 $14,392 0 $0 152 $46,590 APPLICATIONS APPROVED, NOT ACCEPTED 4 $59,288 101 $47,019 148 $41,241 42 $13,890 0 $0 30 $49,275 APPLICATIONS DENIED 48 $65,669 284 $46,899 617 $46,909 226 $13,310 2 $2,365,440 56 $41,515 APPLICATIONS WITHDRAWN 38 $72,012 44 $50,561 391 $49,841 29 $15,445 2 $5,121,850 27 $63,007 FILES CLOSED FOR INCOMPLETENESS 10 $80,596 39 $50,865 87 $51,724 0 $0 1 $2,464,000 5 $44,180
Aggregated Statistics For Year 2000(Based on 11 full and 10 partial tracts) A) FHA, FSA/RHS & VA B) Conventional C) Refinancings D) Home Improvement Loans E) Loans on Dwellings For 5+ Families F) Non-occupant Loans on Number Average Value Number Average Value Number Average Value Number Average Value Number Average Value Number Average Value
LOANS ORIGINATED 411 $61,145 292 $49,748 342 $39,551 109 $16,284 3 $1,020,120 114 $29,821 APPLICATIONS APPROVED, NOT ACCEPTED 27 $63,933 100 $43,943 94 $38,949 74 $16,424 0 $0 19 $28,414 APPLICATIONS DENIED 29 $62,961 311 $43,562 293 $40,388 260 $13,660 0 $0 51 $31,031 APPLICATIONS WITHDRAWN 32 $67,792 63 $51,322 209 $46,318 6 $8,250 1 $4,818,400 17 $50,362 FILES CLOSED FOR INCOMPLETENESS 22 $55,941 35 $50,512 109 $46,526 0 $0 0 $0 4 $39,878
Aggregated Statistics For Year 1999(Based on 8 full and 7 partial tracts) A) FHA, FSA/RHS & VA B) Conventional C) Refinancings D) Home Improvement Loans E) Loans on Dwellings For 5+ Families F) Non-occupant Loans on Number Average Value Number Average Value Number Average Value Number Average Value Number Average Value Number Average Value
LOANS ORIGINATED 364 $56,695 252 $44,610 378 $39,468 102 $13,977 1 $1,800,000 140 $35,494 APPLICATIONS APPROVED, NOT ACCEPTED 9 $59,382 116 $47,644 90 $37,140 60 $13,542 0 $0 28 $42,501 APPLICATIONS DENIED 39 $56,715 409 $41,219 266 $36,992 308 $9,827 2 $1,364,255 49 $31,230 APPLICATIONS WITHDRAWN 23 $56,074 44 $52,609 221 $41,076 17 $15,572 1 $245,850 10 $42,970 FILES CLOSED FOR INCOMPLETENESS 13 $54,385 17 $66,776 101 $41,219 3 $15,357 0 $0 9 $42,503
Private Mortgage Insurance Companies Aggregated Statistics For Year 2009(Based on 10 full and 12 partial tracts) A) Conventional B) Refinancings C) Non-occupant Loans on Number Average Value Number Average Value Number Average Value
LOANS ORIGINATED 19 $58,414 1 $109,000 2 $39,005 APPLICATIONS APPROVED, NOT ACCEPTED 6 $60,762 1 $59,000 1 $78,000 APPLICATIONS DENIED 3 $61,543 0 $0 0 $0 APPLICATIONS WITHDRAWN 2 $44,850 0 $0 0 $0 FILES CLOSED FOR INCOMPLETENESS 4 $70,720 4 $86,330 2 $70,965
Aggregated Statistics For Year 2008(Based on 15 full and 14 partial tracts) A) Conventional B) Refinancings C) Non-occupant Loans on Number Average Value Number Average Value Number Average Value
LOANS ORIGINATED 177 $78,684 23 $82,727 61 $79,192 APPLICATIONS APPROVED, NOT ACCEPTED 92 $92,088 11 $92,642 33 $90,261 APPLICATIONS DENIED 34 $81,875 3 $51,837 19 $84,576 APPLICATIONS WITHDRAWN 13 $85,911 2 $93,810 3 $90,000 FILES CLOSED FOR INCOMPLETENESS 6 $94,927 0 $0 3 $104,363
Aggregated Statistics For Year 2007(Based on 17 full and 14 partial tracts) A) Conventional B) Refinancings C) Non-occupant Loans on Number Average Value Number Average Value Number Average Value
LOANS ORIGINATED 377 $82,017 56 $83,881 79 $76,693 APPLICATIONS APPROVED, NOT ACCEPTED 54 $92,615 22 $96,571 11 $70,056 APPLICATIONS DENIED 26 $98,380 0 $0 8 $69,804 APPLICATIONS WITHDRAWN 24 $79,283 2 $48,900 5 $63,074 FILES CLOSED FOR INCOMPLETENESS 6 $72,237 0 $0 0 $0
Aggregated Statistics For Year 2006(Based on 17 full and 12 partial tracts) A) Conventional B) Refinancings C) Non-occupant Loans on Number Average Value Number Average Value Number Average Value
LOANS ORIGINATED 213 $75,141 27 $79,325 45 $69,392 APPLICATIONS APPROVED, NOT ACCEPTED 25 $91,900 12 $76,863 12 $74,470 APPLICATIONS DENIED 0 $0 4 $59,050 4 $59,050 APPLICATIONS WITHDRAWN 8 $96,100 3 $80,240 3 $74,567 FILES CLOSED FOR INCOMPLETENESS 0 $0 0 $0 0 $0
Aggregated Statistics For Year 2005(Based on 17 full and 12 partial tracts) A) Conventional B) Refinancings C) Non-occupant Loans on Number Average Value Number Average Value Number Average Value
LOANS ORIGINATED 193 $72,908 20 $74,495 32 $56,520 APPLICATIONS APPROVED, NOT ACCEPTED 32 $82,877 16 $79,182 15 $93,027 APPLICATIONS DENIED 5 $101,220 0 $0 0 $0 APPLICATIONS WITHDRAWN 17 $99,592 4 $72,040 6 $93,738 FILES CLOSED FOR INCOMPLETENESS 3 $80,610 3 $60,507 3 $60,507
Aggregated Statistics For Year 2004(Based on 17 full and 14 partial tracts) A) Conventional B) Refinancings C) Non-occupant Loans on Number Average Value Number Average Value Number Average Value
LOANS ORIGINATED 253 $78,113 32 $70,661 39 $57,239 APPLICATIONS APPROVED, NOT ACCEPTED 38 $89,939 13 $64,882 11 $94,535 APPLICATIONS DENIED 12 $73,461 0 $0 6 $49,443 APPLICATIONS WITHDRAWN 23 $84,543 7 $71,743 11 $100,448 FILES CLOSED FOR INCOMPLETENESS 3 $87,140 0 $0 0 $0
Aggregated Statistics For Year 2003(Based on 17 full and 14 partial tracts) A) Conventional B) Refinancings C) Non-occupant Loans on Number Average Value Number Average Value Number Average Value
LOANS ORIGINATED 220 $71,194 63 $76,869 39 $59,230 APPLICATIONS APPROVED, NOT ACCEPTED 44 $95,039 16 $57,958 12 $45,678 APPLICATIONS DENIED 10 $74,107 4 $85,190 4 $59,882 APPLICATIONS WITHDRAWN 5 $79,342 7 $75,437 4 $55,150 FILES CLOSED FOR INCOMPLETENESS 2 $84,200 0 $0 0 $0
Aggregated Statistics For Year 2002(Based on 9 full and 8 partial tracts) A) Conventional B) Refinancings C) Non-occupant Loans on Number Average Value Number Average Value Number Average Value
LOANS ORIGINATED 109 $66,546 16 $74,637 16 $53,594 APPLICATIONS APPROVED, NOT ACCEPTED 29 $74,225 10 $75,129 5 $32,054 APPLICATIONS DENIED 5 $67,708 5 $92,264 1 $53,000 APPLICATIONS WITHDRAWN 12 $65,378 2 $79,290 3 $32,537 FILES CLOSED FOR INCOMPLETENESS 0 $0 0 $0 0 $0
Aggregated Statistics For Year 2001(Based on 11 full and 8 partial tracts) A) Conventional B) Refinancings C) Non-occupant Loans on Number Average Value Number Average Value Number Average Value
LOANS ORIGINATED 84 $61,080 15 $64,366 14 $44,724 APPLICATIONS APPROVED, NOT ACCEPTED 19 $59,006 2 $41,290 4 $49,282 APPLICATIONS DENIED 10 $68,726 0 $0 3 $65,607 APPLICATIONS WITHDRAWN 5 $61,162 2 $22,505 2 $22,505 FILES CLOSED FOR INCOMPLETENESS 2 $40,505 0 $0 0 $0
Aggregated Statistics For Year 2000(Based on 11 full and 10 partial tracts) A) Conventional B) Refinancings C) Non-occupant Loans on Number Average Value Number Average Value Number Average Value
LOANS ORIGINATED 121 $67,266 29 $52,560 20 $30,945 APPLICATIONS APPROVED, NOT ACCEPTED 10 $63,290 2 $41,645 0 $0 APPLICATIONS DENIED 4 $83,430 0 $0 0 $0 APPLICATIONS WITHDRAWN 6 $33,297 2 $36,040 2 $39,375 FILES CLOSED FOR INCOMPLETENESS 3 $47,063 0 $0 0 $0
Aggregated Statistics For Year 1999(Based on 7 full and 6 partial tracts) A) Conventional B) Refinancings C) Non-occupant Loans on Number Average Value Number Average Value Number Average Value
LOANS ORIGINATED 64 $57,080 17 $53,087 19 $40,348 APPLICATIONS APPROVED, NOT ACCEPTED 6 $41,570 6 $44,977 6 $33,153 APPLICATIONS DENIED 11 $55,125 1 $38,510 4 $45,848 APPLICATIONS WITHDRAWN 2 $60,250 0 $0 1 $27,400 FILES CLOSED FOR INCOMPLETENESS 4 $40,550 3 $55,717 2 $33,330
2002 - 2018 National Fire Incident Reporting System (NFIRS) incidents See full 2006 National Fire Incident Reporting System statistics for zip code 75217, Texas
Most common first names in zip code 75217 among deceased individuals Name Count Lived (average)
James 323 68.2 years Mary 274 74.7 years John 273 70.0 years William 244 72.6 years Robert 194 68.2 years Willie 145 72.5 years Charles 127 67.5 years George 115 72.1 years Thomas 108 68.9 years Henry 98 70.4 years
Most common last names in zip code 75217 among deceased individuals Last name Count Lived (average)
Smith 202 70.4 years Williams 152 69.4 years Jones 112 68.7 years Johnson 106 71.8 years Brown 99 68.9 years Davis 85 68.2 years Thompson 74 69.8 years Wilson 69 70.4 years Taylor 65 72.6 years Jackson 63 67.3 years
Businesses in zip code 75217
Name Count Name Count
7-Eleven 2 Little Caesars Pizza 1 99 Cents Only Stores 1 Long John Silver's 1 Ace Hardware 1 McDonald's 1 AutoZone 3 Nike 4 Blockbuster 1 Payless 1 CVS 1 Penske 1 Church's Chicken 3 Popeyes 1 Circle K 1 RadioShack 1 Discount Tire 1 SONIC Drive-In 2 Domino's Pizza 1 T-Mobile 1 FedEx 1 Taco Bell 1 H&R Block 2 U-Haul 3 Jack In The Box 1 Walgreens 2 KFC 1 Wendy's 2
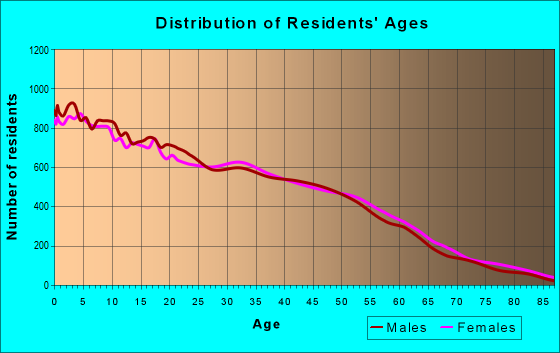
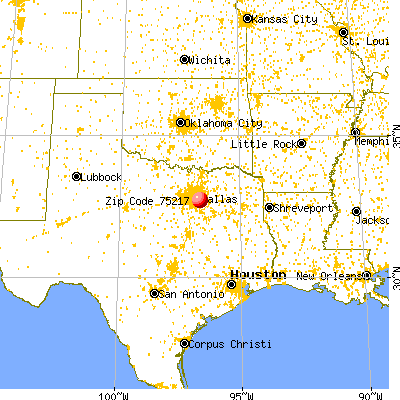


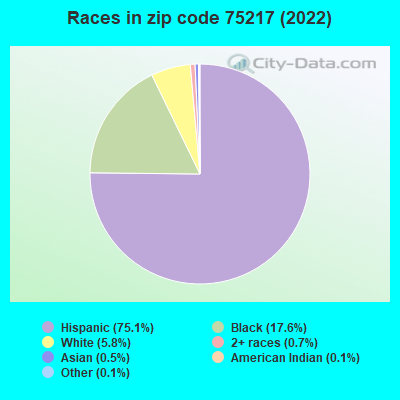


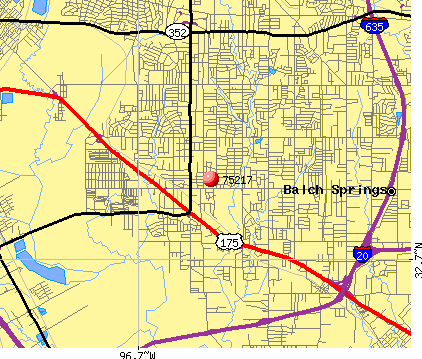 Nearest zip codes: 75227, 75180, 75141, 75253, 75149, 75215.
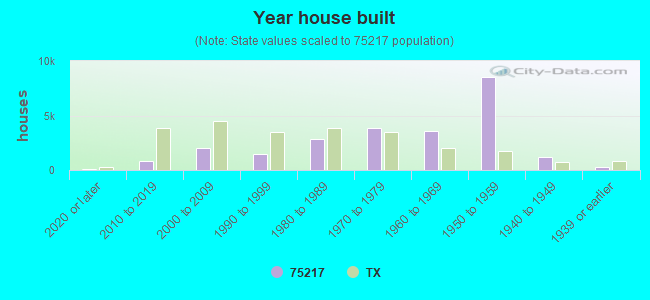

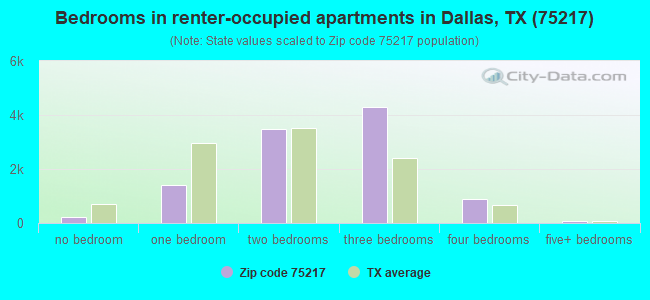
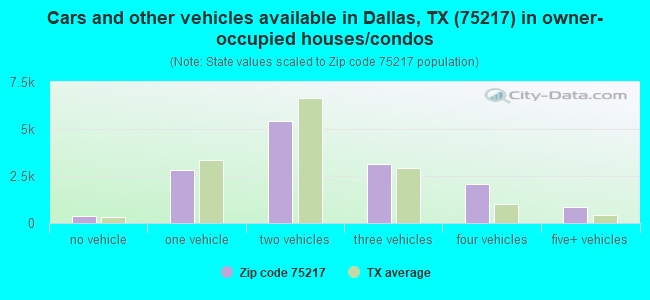
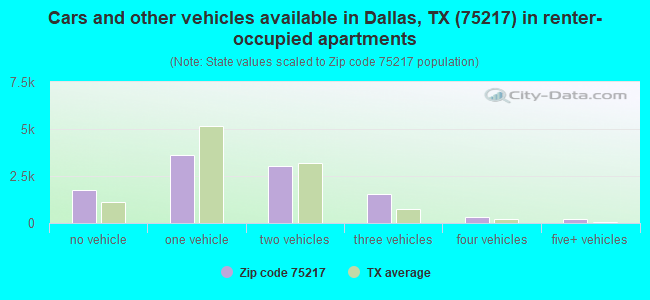


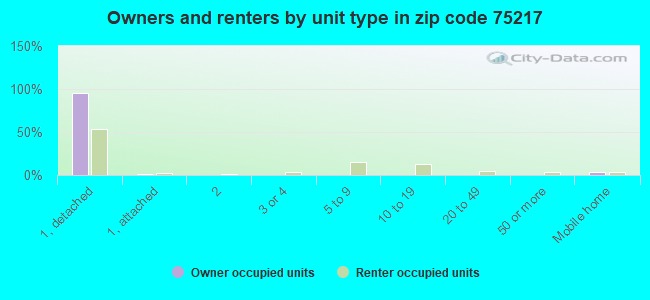
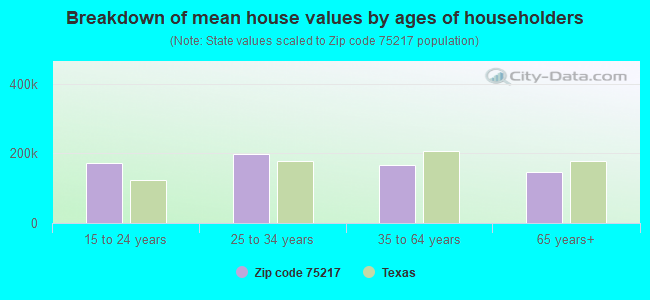


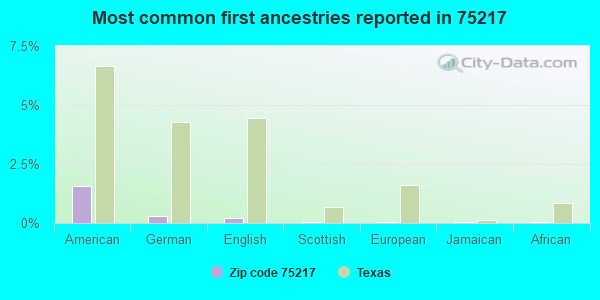
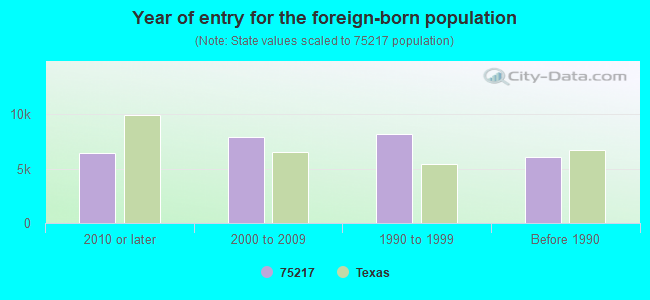


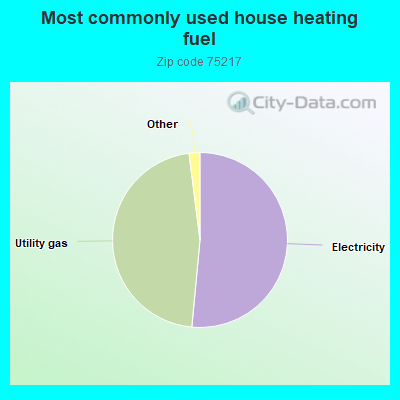

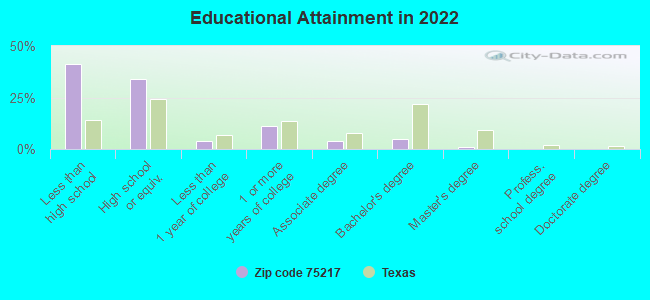
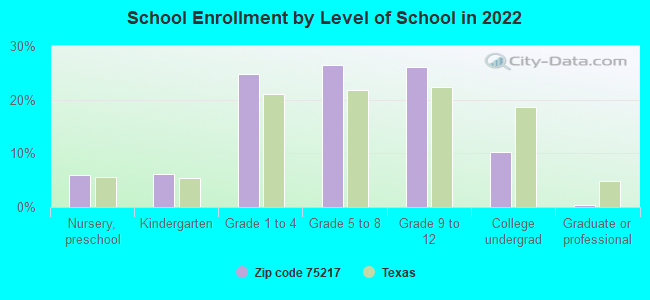

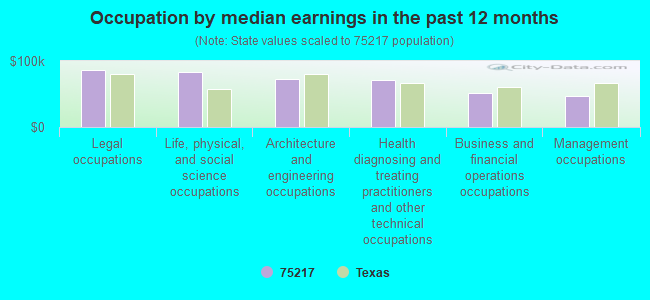
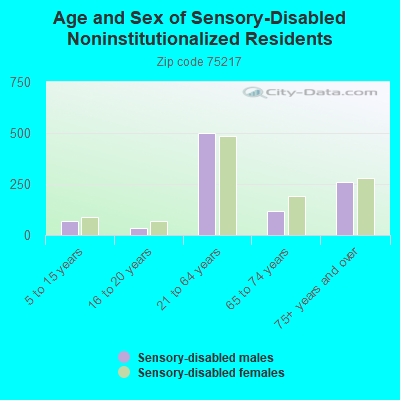
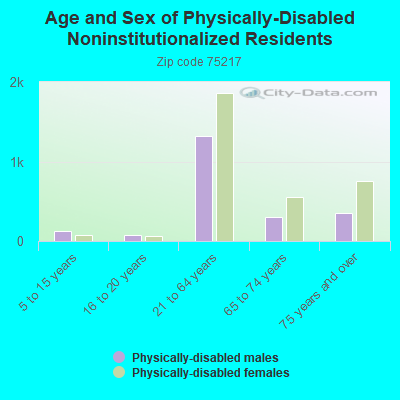

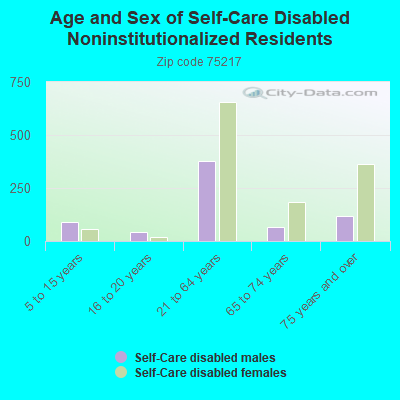

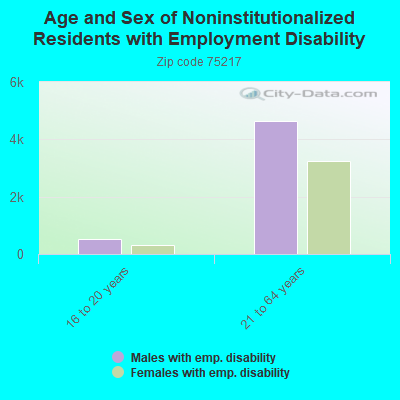
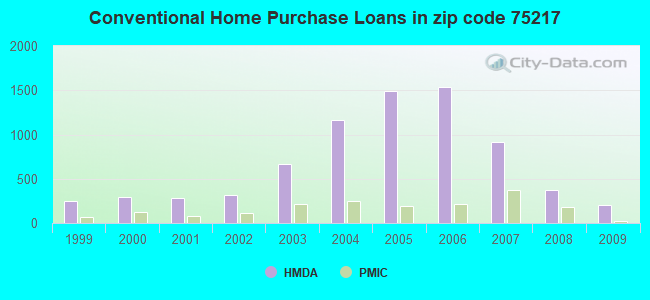
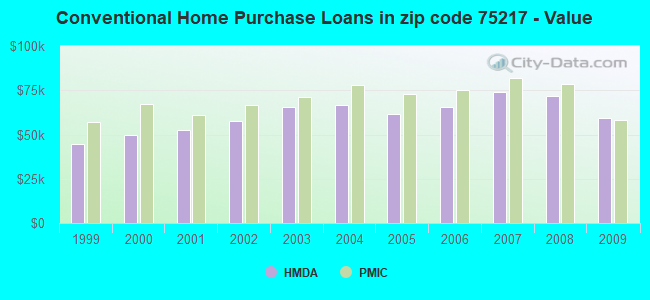
 Based on the data from the years 2002 - 2018 the average number of fires per year is 221. The highest number of reported fire incidents - 504 took place in 2002, and the least - 3 in 2008. The data has a decreasing trend.
 When looking into fire subcategories, the most incidents belonged to: Outside Fires (46.0%), and Mobile Property/Vehicle Fires (25.9%).