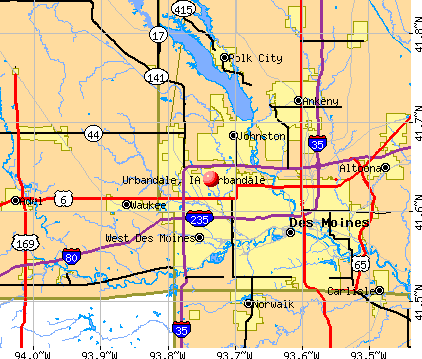
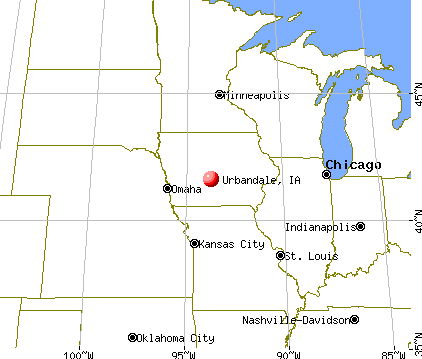
Urbandale, Iowa
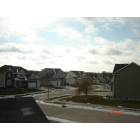
Urbandale: winter in URBANDALE

Urbandale: Spring Friends
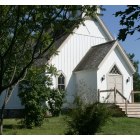
Urbandale: Church at Living History Farms

Urbandale: Blossoms in Lake Hollise Neighborhood
- add
your
Submit your own pictures of this city and show them to the world
- OSM Map
- General Map
- Google Map
- MSN Map
Population change since 2000: +60.5%
| Males: 23,617 | |
| Females: 23,031 |
| Median resident age: | 39.1 years |
| Iowa median age: | 38.9 years |
Zip codes: 50322.
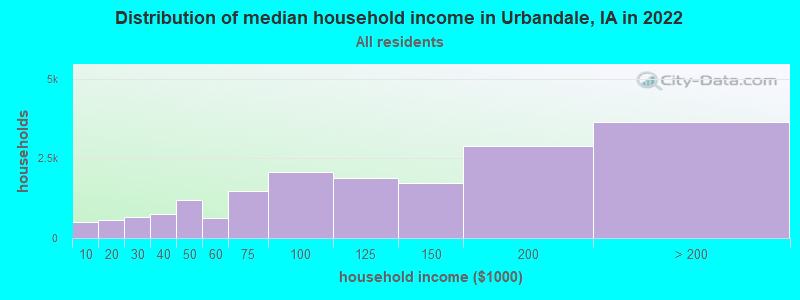
| Urbandale: | $109,349 |
| IA: | $69,588 |
Estimated per capita income in 2022: $53,910 (it was $29,021 in 2000)
Urbandale city income, earnings, and wages data
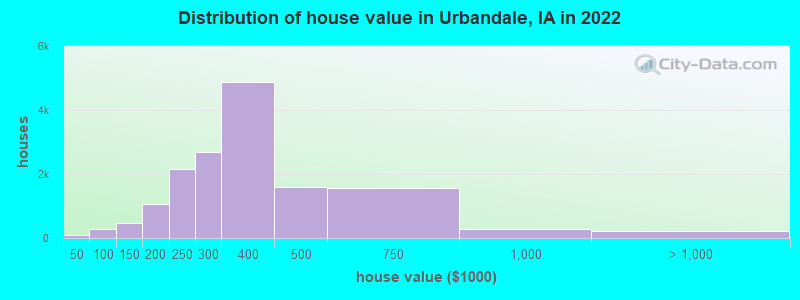
Estimated median house or condo value in 2022: $324,619 (it was $131,100 in 2000)
| Urbandale: | $324,619 |
| IA: | $194,600 |
Mean prices in 2022: all housing units: $355,718; detached houses: $383,830; townhouses or other attached units: $225,710; in 2-unit structures: $171,555; in 3-to-4-unit structures: $111,796; in 5-or-more-unit structures: $110,902; mobile homes: $126,695
Median gross rent in 2022: $1,092.
(3.1% for White Non-Hispanic residents, 7.3% for Black residents, 13.4% for Hispanic or Latino residents, 51.4% for American Indian residents, 14.6% for other race residents, 18.8% for two or more races residents)
Detailed information about poverty and poor residents in Urbandale, IA


Compare current foreclosures in Urbandale, IA:
| Photo | Address | Area | Beds / Baths | Price | Details |
|---|---|---|---|---|---|

|
#1
61st St
Urbandale, IA 50322
|
748 sq. feet
|
2 baths 2 beds |
show details | |

|
#2
65th St
Urbandale, IA 50322
|
1,321 sq. feet
|
2 baths 3 beds |
show details | |

|
#3
153rd St
Urbandale, IA 50323
|
3,192 sq. feet
|
5 baths 5 beds |
show details | |

|
#4
Dellwood Dr
Urbandale, IA 50322
|
1,064 sq. feet
|
2 baths 2 beds |
show details | |

|
#5
59th St
Urbandale, IA 50322
|
672 sq. feet
|
2 baths 2 beds |
show details | |

|
#6
163rd St
Urbandale, IA 50323
|
2,568 sq. feet
|
6 baths 4 beds |
show details | |

|
#7
69th St
Urbandale, IA 50322
|
816 sq. feet
|
2 baths 3 beds |
show details | |

|
#8
156th St
Urbandale, IA 50323
|
1,900 sq. feet
|
4 baths 4 beds |
show details | |

|
#9
Alpine Dr
Urbandale, IA 50322
|
1,580 sq. feet
|
3 baths 3 beds |
show details | |

|
#10
New York Ave
Urbandale, IA 50322
|
1,417 sq. feet
|
1 baths 3 beds |
show details |
| Photo | Address | Area | Beds / Baths | Price | Details |
|---|---|---|---|---|---|

|
#11
Northview Dr
Urbandale, IA 50322
|
1,388 sq. feet
|
2 baths 3 beds |
show details | |

|
#12
64th St
Urbandale, IA 50322
|
2,277 sq. feet
|
2 baths 4 beds |
show details | |

|
#13
Sutton Pl Apt 11
Urbandale, IA 50322
|
902 sq. feet
|
2 baths 2 beds |
show details | |

|
#14
Greenbelt Dr
Urbandale, IA 50323
|
1,056 sq. feet
|
2 baths 2 beds |
show details | |

|
#15
Ridgeview Dr
Urbandale, IA 50323
|
2,587 sq. feet
|
- baths 1 beds |
show details | |

|
#16
71st St
Urbandale, IA 50322
|
2,071 sq. feet
|
2 baths 3 beds |
show details | |

|
#17
Oliver Smith Dr
Urbandale, IA 50322
|
1,200 sq. feet
|
1 baths 3 beds |
show details | |

|
#18
Sutton Dr # 4
Urbandale, IA 50322
|
864 sq. feet
|
1 baths 2 beds |
show details | |

|
#19
65th St
Urbandale, IA 50322
|
1,437 sq. feet
|
1 baths 3 beds |
show details | |

|
#20
Wildflower Ln
Urbandale, IA 50322
|
1,527 sq. feet
|
2 baths 3 beds |
show details |
| Photo | Address | Area | Beds / Baths | Price | Details |
|---|---|---|---|---|---|

|
#21
83rd St
Urbandale, IA 50322
|
1,564 sq. feet
|
2 baths 3 beds |
show details | |

|
#22
77th St
Urbandale, IA 50322
|
1,841 sq. feet
|
1 baths 4 beds |
show details | |

|
#23
Hammontree Dr
Urbandale, IA 50322
|
2,263 sq. feet
|
1 baths 3 beds |
show details | |

|
#24
66th St
Urbandale, IA 50322
|
1,625 sq. feet
|
1 baths 2 beds |
show details | |

|
#25
67th St
Urbandale, IA 50322
|
720 sq. feet
|
1 baths 2 beds |
show details | |

|
#26
Alpine Dr
Urbandale, IA 50322
|
1,580 sq. feet
|
2 baths 3 beds |
show details | |

|
#27
87th St
Urbandale, IA 50322
|
1,505 sq. feet
|
2 baths 2 beds |
show details | |

|
#28
66th St
Urbandale, IA 50322
|
1,696 sq. feet
|
2 baths 3 beds |
show details | |

|
#29
Valdez Dr
Urbandale, IA 50322
|
1,420 sq. feet
|
1 baths 2 beds |
show details | |

|
#30
Hillsdale Dr
Urbandale, IA 50322
|
1,658 sq. feet
|
2 baths 3 beds |
show details |
| Photo | Address | Area | Beds / Baths | Price | Details |
|---|---|---|---|---|---|

|
#31
67th St
Urbandale, IA 50322
|
1,760 sq. feet
|
2 baths 3 beds |
show details | |

|
#32
Franklin Ave
Urbandale, IA 50322
|
936 sq. feet
|
2 baths 2 beds |
show details | |

|
#33
Brookview Dr
Urbandale, IA 50322
|
1,212 sq. feet
|
2 baths 3 beds |
show details | |

|
#34
Hickory Ln
Urbandale, IA 50322
|
1,907 sq. feet
|
2 baths 3 beds |
show details | |

|
#35
92nd Dr
Urbandale, IA 50322
|
1,327 sq. feet
|
1 baths 2 beds |
show details | |

|
#36
Boston Ave
Urbandale, IA 50322
|
1,994 sq. feet
|
2 baths - beds |
show details | |

|
#37
Oakwood Dr
Urbandale, IA 50322
|
1,144 sq. feet
|
1 baths - beds |
show details | |

|
#38
Goldenrod Dr
Urbandale, IA 50323
|
- sq. feet
|
- baths - beds |
show details | |

|
#39
Meredith Dr
Urbandale, IA 50322
|
- sq. feet
|
- baths - beds |
show details | |

|
#40
Alpine Dr
Urbandale, IA 50323
|
- sq. feet
|
- baths - beds |
show details |
| Photo | Address | Area | Beds / Baths | Price | Details |
|---|---|---|---|---|---|

|
#41
Holcomb Ave, Apt 112
Urbandale, IA 50323
|
- sq. feet
|
- baths - beds |
show details | |

|
#42
Deerview Dr
Urbandale, IA 50323
|
- sq. feet
|
- baths - beds |
show details | |

|
#43
Brookview Pl
Urbandale, IA 50322
|
- sq. feet
|
- baths - beds |
show details | |

|
Check over 1 million property listings on Foreclosure.com!
|
browse all offers | |||


- 37,24780.4%White alone
- 2,7986.0%Hispanic
- 2,2925.0%Asian alone
- 2,0934.5%Black alone
- 1,2072.6%Two or more races
- 4260.9%Other race alone
- 590.1%American Indian alone
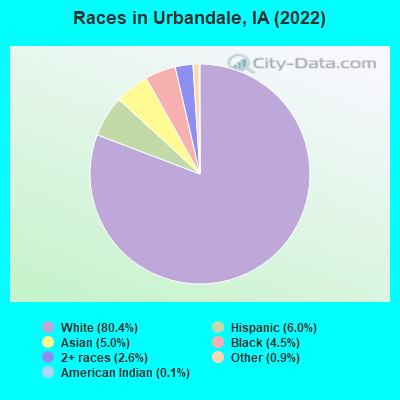
Races in Urbandale detailed stats: ancestries, foreign born residents, place of birth
According to our research of Iowa and other state lists, there were 38 registered sex offenders living in Urbandale, Iowa as of June 10, 2024.
The ratio of all residents to sex offenders in Urbandale is 1,130 to 1.
The ratio of registered sex offenders to all residents in this city is lower than the state average.
Type |
2009 |
2010 |
2011 |
2012 |
2013 |
2014 |
2015 |
2016 |
2017 |
2018 |
2019 |
2020 |
2021 |
2022 |
|---|---|---|---|---|---|---|---|---|---|---|---|---|---|---|
| Murders (per 100,000) | 0 (0.0) | 0 (0.0) | 0 (0.0) | 0 (0.0) | 0 (0.0) | 0 (0.0) | 1 (2.3) | 1 (2.2) | 0 (0.0) | 0 (0.0) | 0 (0.0) | 1 (2.2) | 0 (0.0) | 0 (0.0) |
| Rapes (per 100,000) | 7 (17.7) | 12 (30.4) | 8 (20.2) | 4 (9.9) | 5 (12.0) | 14 (33.1) | 8 (18.1) | 11 (24.4) | 14 (32.1) | 13 (29.4) | 20 (44.9) | 8 (17.8) | 5 (11.1) | 3 (6.5) |
| Robberies (per 100,000) | 7 (17.7) | 4 (10.1) | 6 (15.1) | 2 (4.9) | 7 (16.9) | 4 (9.4) | 4 (9.1) | 8 (17.8) | 9 (20.6) | 4 (9.0) | 4 (9.0) | 5 (11.1) | 10 (22.1) | 3 (6.5) |
| Assaults (per 100,000) | 34 (86.0) | 42 (106.4) | 49 (123.5) | 52 (128.5) | 55 (132.5) | 66 (155.9) | 40 (90.7) | 49 (108.9) | 100 (229.2) | 37 (83.7) | 24 (53.9) | 33 (73.4) | 38 (84.1) | 43 (92.9) |
| Burglaries (per 100,000) | 146 (369.5) | 123 (311.7) | 111 (279.8) | 109 (269.4) | 129 (310.9) | 69 (163.0) | 129 (292.6) | 177 (393.2) | 154 (352.9) | 77 (174.2) | 71 (159.4) | 63 (140.1) | 62 (137.2) | 36 (77.8) |
| Thefts (per 100,000) | 643 (1,627) | 579 (1,467) | 516 (1,301) | 563 (1,391) | 516 (1,243) | 586 (1,384) | 488 (1,107) | 484 (1,075) | 376 (861.7) | 297 (671.8) | 464 (1,042) | 343 (762.9) | 280 (619.5) | 236 (509.9) |
| Auto thefts (per 100,000) | 27 (68.3) | 20 (50.7) | 29 (73.1) | 33 (81.5) | 25 (60.2) | 42 (99.2) | 53 (120.2) | 46 (102.2) | 49 (112.3) | 35 (79.2) | 47 (105.5) | 60 (133.5) | 66 (146.0) | 48 (103.7) |
| Arson (per 100,000) | 3 (7.6) | 3 (7.6) | 3 (7.6) | 7 (17.3) | 2 (4.8) | 1 (2.4) | 7 (15.9) | 4 (8.9) | 6 (13.7) | 1 (2.3) | 1 (2.2) | 3 (6.7) | 2 (4.4) | 0 (0.0) |
| City-Data.com crime index | 133.1 | 133.2 | 122.8 | 116.1 | 117.5 | 135.2 | 114.3 | 129.8 | 145.8 | 88.4 | 110.7 | 87.7 | 78.4 | 59.8 |
The City-Data.com crime index weighs serious crimes and violent crimes more heavily. Higher means more crime, U.S. average is 246.1. It adjusts for the number of visitors and daily workers commuting into cities.
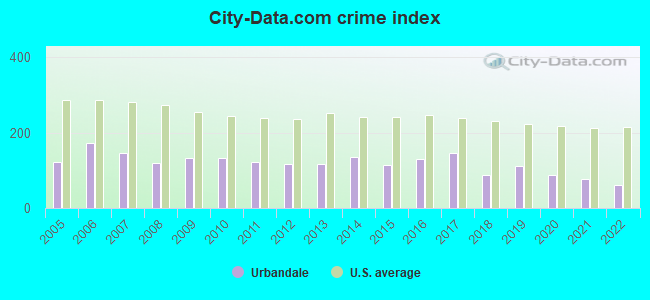
Crime rate in Urbandale detailed stats: murders, rapes, robberies, assaults, burglaries, thefts, arson
Full-time law enforcement employees in 2021, including police officers: 61 (52 officers - 43 male; 9 female).
| Officers per 1,000 residents here: | 1.15 |
| Iowa average: | 1.76 |
 Recent articles from our blog. Our writers, many of them Ph.D. graduates or candidates, create easy-to-read articles on a wide variety of topics.

 | Urbandale vs. Ankeny Schools? (3 replies) |
| Moving to Des Moines/Urbandale from Sacramento, CA (2 replies) |
| Relo to Des Moines (15 replies) |
| From Politico Magazine. The reawakening & emergence of Des Moines did not happen by accident (35 replies) |
| Seeking Honest, Skilled Dentist (10 replies) |
| Moving to des moines soon! (14 replies) |
Latest news from Urbandale, IA collected exclusively by city-data.com from local newspapers, TV, and radio stations
Ancestries: German (24.3%), English (9.2%), Irish (5.6%), Yugoslavian (4.8%), American (4.7%), European (3.3%).
Current Local Time: CST time zone
Incorporated on 05/3/1917
Land area: 20.7 square miles.
Population density: 2,254 people per square mile (low).
4,328 residents are foreign born (3.6% Asia, 2.9% Europe, 1.3% Africa, 1.3% Latin America).
| This city: | 9.3% |
| Iowa: | 5.6% |
Median real estate property taxes paid for housing units with mortgages in 2022: $5,125 (1.5%)
Median real estate property taxes paid for housing units with no mortgage in 2022: $5,107 (1.7%)
Nearest city with pop. 50,000+: Des Moines, IA  (6.7 miles , pop. 198,682).
Nearest city with pop. 200,000+: Omaha, NE (120.9 miles , pop. 390,007).
Nearest city with pop. 1,000,000+: Chicago, IL (312.9 miles , pop. 2,896,016).
Nearest cities:
), ), )Latitude: 41.64 N, Longitude: 93.74 W
Daytime population change due to commuting: +4,220 (+9.1%)
Workers who live and work in this city: 8,492 (33.6%)
Area code commonly used in this area: 515
Property values in Urbandale, IA

Urbandale, Iowa accommodation & food services, waste management - Economy and Business Data
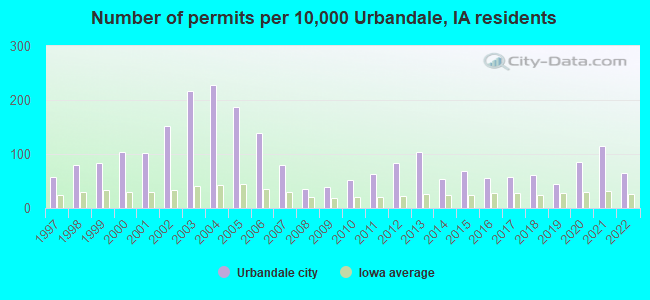
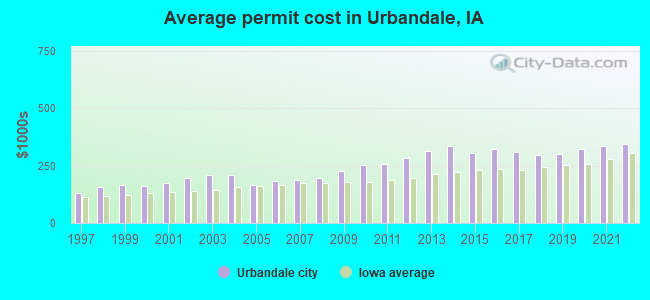
Single-family new house construction building permits:
- 2022: 188 buildings, average cost: $343,600
- 2021: 334 buildings, average cost: $337,300
- 2020: 246 buildings, average cost: $323,800
- 2019: 130 buildings, average cost: $303,200
- 2018: 177 buildings, average cost: $296,700
- 2017: 168 buildings, average cost: $310,100
- 2016: 159 buildings, average cost: $320,500
- 2015: 197 buildings, average cost: $305,100
- 2014: 156 buildings, average cost: $335,300
- 2013: 300 buildings, average cost: $313,200
- 2012: 241 buildings, average cost: $282,100
- 2011: 182 buildings, average cost: $256,500
- 2010: 147 buildings, average cost: $250,800
- 2009: 114 buildings, average cost: $225,600
- 2008: 104 buildings, average cost: $198,400
- 2007: 233 buildings, average cost: $188,400
- 2006: 403 buildings, average cost: $181,000
- 2005: 545 buildings, average cost: $167,400
- 2004: 663 buildings, average cost: $208,000
- 2003: 627 buildings, average cost: $209,000
- 2002: 441 buildings, average cost: $197,400
- 2001: 294 buildings, average cost: $176,300
- 2000: 301 buildings, average cost: $160,200
- 1999: 241 buildings, average cost: $166,200
- 1998: 234 buildings, average cost: $155,400
- 1997: 169 buildings, average cost: $128,500
| Here: | 2.0% |
| Iowa: | 2.7% |
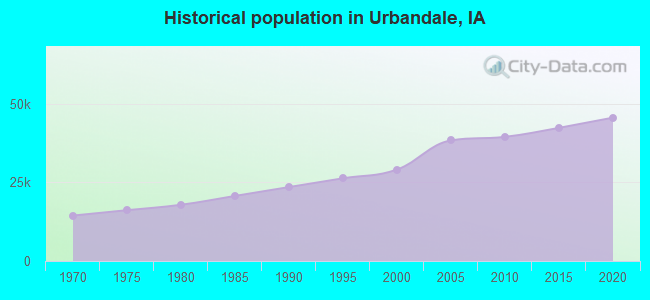
Population change in the 1990s: +5,466 (+23.2%).
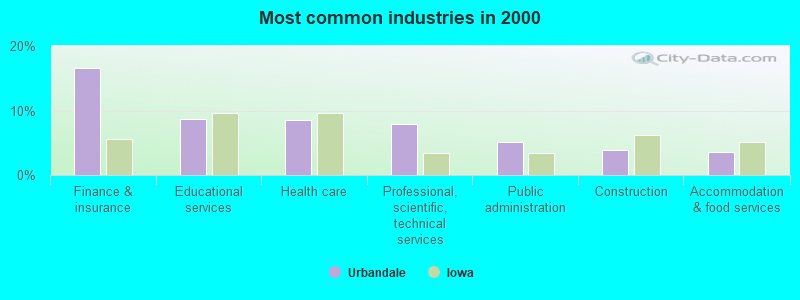
- Finance & insurance (16.6%)
- Educational services (8.7%)
- Health care (8.5%)
- Professional, scientific, technical services (7.9%)
- Public administration (5.1%)
- Construction (3.8%)
- Accommodation & food services (3.6%)
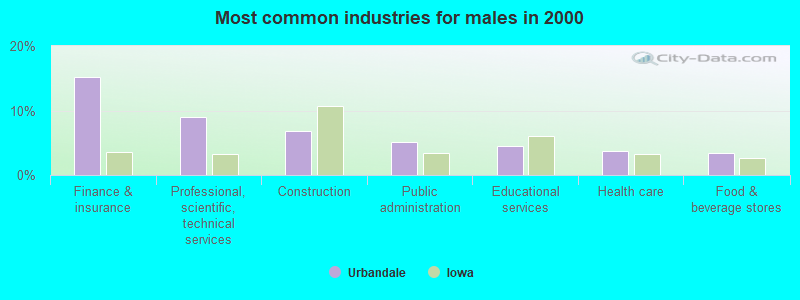
- Finance & insurance (15.3%)
- Professional, scientific, technical services (9.0%)
- Construction (6.8%)
- Public administration (5.1%)
- Educational services (4.5%)
- Health care (3.8%)
- Food & beverage stores (3.4%)
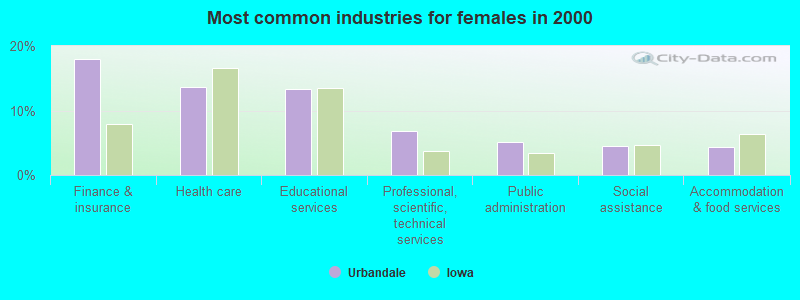
- Finance & insurance (18.0%)
- Health care (13.6%)
- Educational services (13.3%)
- Professional, scientific, technical services (6.8%)
- Public administration (5.1%)
- Social assistance (4.5%)
- Accommodation & food services (4.3%)
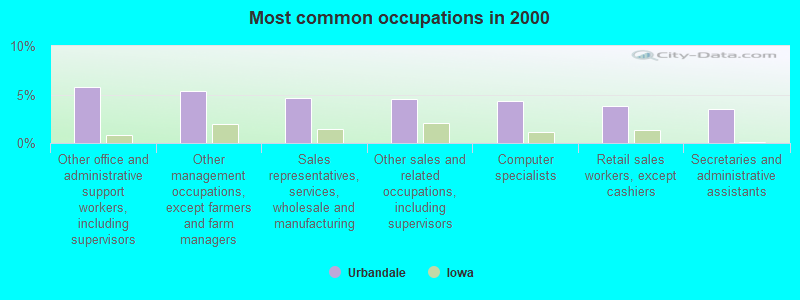
- Other office and administrative support workers, including supervisors (5.8%)
- Other management occupations, except farmers and farm managers (5.3%)
- Sales representatives, services, wholesale and manufacturing (4.7%)
- Other sales and related occupations, including supervisors (4.6%)
- Computer specialists (4.3%)
- Retail sales workers, except cashiers (3.8%)
- Secretaries and administrative assistants (3.5%)
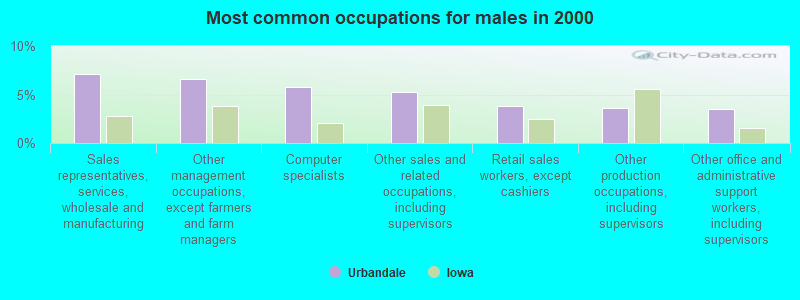
- Sales representatives, services, wholesale and manufacturing (7.1%)
- Other management occupations, except farmers and farm managers (6.6%)
- Computer specialists (5.7%)
- Other sales and related occupations, including supervisors (5.2%)
- Retail sales workers, except cashiers (3.8%)
- Other production occupations, including supervisors (3.6%)
- Other office and administrative support workers, including supervisors (3.5%)
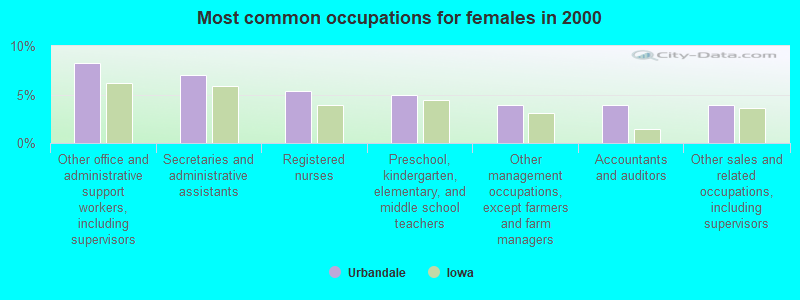
- Other office and administrative support workers, including supervisors (8.2%)
- Secretaries and administrative assistants (7.0%)
- Registered nurses (5.4%)
- Preschool, kindergarten, elementary, and middle school teachers (4.9%)
- Other management occupations, except farmers and farm managers (4.0%)
- Accountants and auditors (3.9%)
- Other sales and related occupations, including supervisors (3.9%)
Average climate in Urbandale, Iowa
Based on data reported by over 4,000 weather stations


|
|


(lower is better)
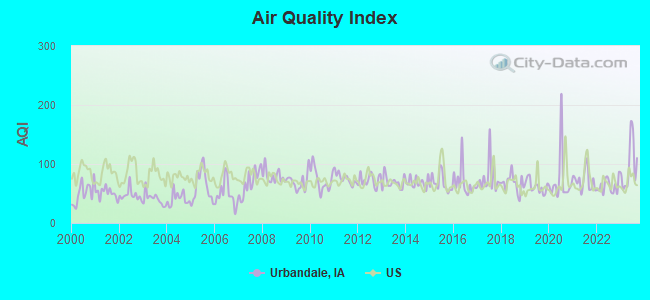
Air Quality Index (AQI) level in 2023 was 97.4. This is worse than average.
| City: | 97.4 |
| U.S.: | 72.6 |
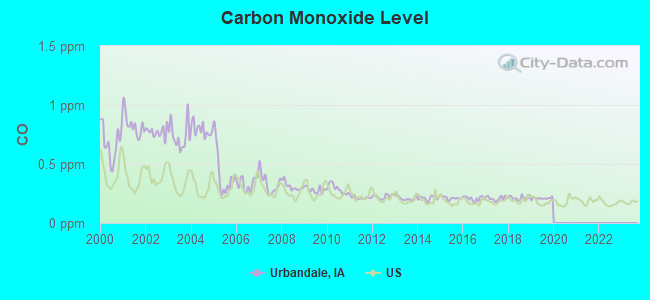
Carbon Monoxide (CO) [ppm] level in 2019 was 0.209. This is better than average. Closest monitor was 3.2 miles away from the city center.
| City: | 0.209 |
| U.S.: | 0.251 |
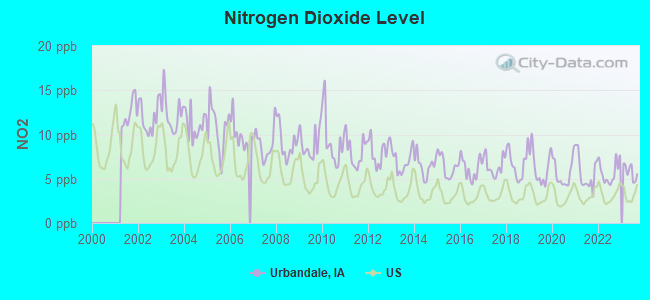
Nitrogen Dioxide (NO2) [ppb] level in 2023 was 5.78. This is about average. Closest monitor was 4.6 miles away from the city center.
| City: | 5.78 |
| U.S.: | 5.11 |
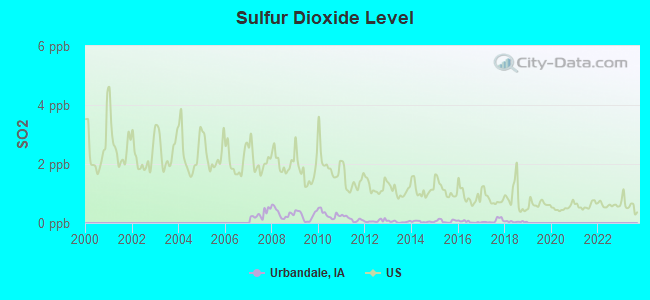
Sulfur Dioxide (SO2) [ppb] level in 2018 was 0.0417. This is significantly better than average. Closest monitor was 4.6 miles away from the city center.
| City: | 0.0417 |
| U.S.: | 1.5147 |
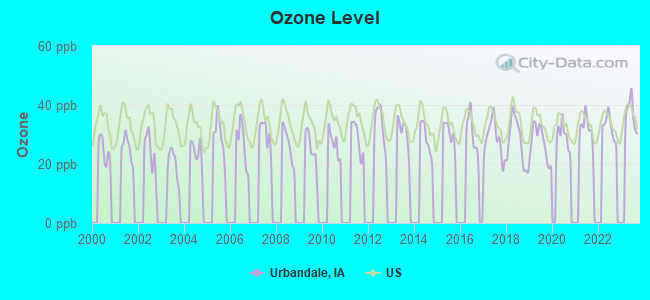
Ozone [ppb] level in 2023 was 36.8. This is about average. Closest monitor was 5.3 miles away from the city center.
| City: | 36.8 |
| U.S.: | 33.3 |
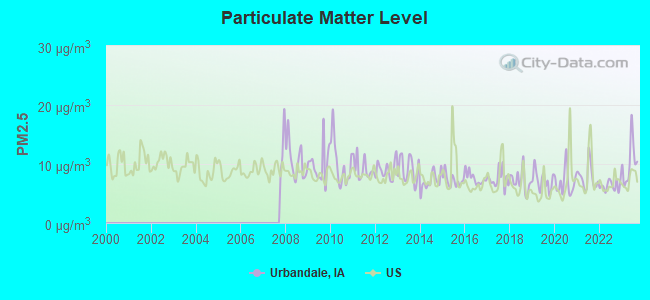
Particulate Matter (PM2.5) [µg/m3] level in 2023 was 10.2. This is worse than average. Closest monitor was 2.4 miles away from the city center.
| City: | 10.2 |
| U.S.: | 8.1 |
Tornado activity:
Urbandale-area historical tornado activity is near Iowa state average. It is 108% greater than the overall U.S. average.
On 6/13/1976, a category F5 (max. wind speeds 261-318 mph) tornado 21.4 miles away from the Urbandale city center injured 9 people and caused between $5,000,000 and $50,000,000 in damages.
On 6/18/1974, a category F4 (max. wind speeds 207-260 mph) tornado 8.8 miles away from the city center killed 2 people and injured 50 people and caused between $5,000,000 and $50,000,000 in damages.
Earthquake activity:
Urbandale-area historical earthquake activity is significantly above Iowa state average. It is 218% greater than the overall U.S. average.On 9/3/2016 at 12:02:44, a magnitude 5.8 (5.8 MW, Depth: 3.5 mi, Class: Moderate, Intensity: VI - VII) earthquake occurred 399.1 miles away from the city center
On 4/18/2008 at 09:36:59, a magnitude 5.4 (5.1 MB, 4.8 MS, 5.4 MW, 5.2 MW) earthquake occurred 379.9 miles away from the city center
On 11/6/2011 at 03:53:10, a magnitude 5.7 (5.7 MW, Depth: 3.2 mi) earthquake occurred 452.8 miles away from Urbandale center
On 4/18/2008 at 09:36:59, a magnitude 5.2 (5.2 MW, Depth: 8.9 mi) earthquake occurred 380.0 miles away from Urbandale center
On 6/10/1987 at 23:48:54, a magnitude 5.1 (4.9 MB, 4.4 MS, 4.6 MS, 5.1 LG) earthquake occurred 365.1 miles away from the city center
On 7/9/1975 at 14:54:15, a magnitude 4.6 (4.6 MB, Class: Light, Intensity: IV - V) earthquake occurred 301.8 miles away from the city center
Magnitude types: regional Lg-wave magnitude (LG), body-wave magnitude (MB), surface-wave magnitude (MS), moment magnitude (MW)
Natural disasters:
The number of natural disasters in Polk County (17) is near the US average (15).Major Disasters (Presidential) Declared: 13
Emergencies Declared: 1
Causes of natural disasters: Floods: 12, Storms: 10, Tornadoes: 5, Heavy Rain: 1, Hurricane: 1, Snow: 1, Wind: 1, Winter Storm: 1, Other: 1 (Note: some incidents may be assigned to more than one category).

Hospitals and medical centers in Urbandale:
- CHILDSERVE HOMES-DOUGLAS AVENUE HOUSE (7109 DOUGLAS AVENUE)
- CHILDSERVE HOMES-URBANDALE HOUSE (2712 69TH STREET)
- SOUTHERN CARE (2900 100TH STREET SUITE 103)
- IOWA HEALTH HOME CARE (11333 AURORA AVENUE)
- DEERFIELD RETIREMENT COMMUNITY INC (13731 HICKMAN ROAD)
- KAREN ACRES CARE CENTER (3605 ELM DRIVE)
- URBANDALE HEALTH CARE CENTER (4614 NW 84TH STREET)
College/University in Urbandale:
Colleges/universities with over 2000 students nearest to Urbandale:
- Drake University (about 5 miles; Des Moines, IA; Full-time enrollment: 3,768)
- Des Moines Area Community College (about 9 miles; Ankeny, IA; FT enrollment: 15,337)
- Iowa State University (about 28 miles; Ames, IA; FT enrollment: 28,662)
- Iowa Central Community College (about 64 miles; Fort Dodge, IA; FT enrollment: 4,682)
- Indian Hills Community College (about 81 miles; Ottumwa, IA; FT enrollment: 4,034)
- University of Northern Iowa (about 90 miles; Cedar Falls, IA; FT enrollment: 10,816)
- Hawkeye Community College (about 91 miles; Waterloo, IA; FT enrollment: 7,160)
Public high school in Urbandale:
- URBANDALE HIGH SCHOOL (Students: 1,127, Location: 7111 AURORA AVENUE, Grades: 9-12)
Private high school in Urbandale:
- DES MOINES CHRISTIAN SCHOOL (Students: 976, Location: 13007 DOUGLAS PKWY STE 100, Grades: PK-12)
Public elementary/middle schools in Urbandale:
- URBANDALE MIDDLE SCHOOL (Students: 805, Location: 7701 AURORA AVENUE, Grades: 6-8)
- WALNUT HILLS ELEMENTARY (Students: 706, Location: 4240 156TH ST, Grades: PK-5)
- OLMSTED ELEMENTARY SCHOOL (Students: 456, Location: 7110 PRAIRIE AVENUE, Grades: PK-5)
- VALERIUS ELEMENTARY SCHOOL (Students: 278, Location: 3305 92ND STREET, Grades: KG-5)
- KAREN ACRES ELEMENTARY SCHOOL (Students: 273, Location: 3500 74TH STREET, Grades: KG-5)
- ROLLING GREEN ELEMENTARY SCHOOL (Students: 231, Location: 8100 AIRLINE AVENUE, Grades: PK-5)
- JENSEN ELEMENTARY SCHOOL (Students: 195, Location: 6301 AURORA AVENUE, Grades: KG-5)
- WEBSTER ELEMENTARY SCHOOL (Students: 171, Location: 12955 AURORA AVENUE, Grades: PK-5)
Private elementary/middle school in Urbandale:
- ST PIUS X SCHOOL (Students: 370, Location: 3601 66TH ST, Grades: PK-8)
Points of interest:
Notable locations in Urbandale: Urbandale Country Club (A), Living History Farms Welcome Center (B), Urbandale Public Library (C), Urbandale Police Department (D), Urbandale Fire Department Station 42 Headquarters (E), Urbandale Fire Department Station 41 (F), Urbandale Town Hall (G). Display/hide their locations on the map
Shopping Center: Cedar Ridge Shopping Center (1). Display/hide its location on the map
Churches in Urbandale include: Urbandale Baptist Church (A), Gloria Dei Lutheran Church (B), Westkirk Presbyterian Church (C), Free Methodist Church (D), Walnut Hills United Methodist Church (E), Gospel Assembly Church (F), New Hope Assembly of God Church (G), Saint Pius X Church (H), Church of Jesus Christ (I). Display/hide their locations on the map
Cemeteries: Chapel Hill Gardens Cemetery (1), McDivitt Cemetery (2). Display/hide their locations on the map
Lake: Lake Halice (A). Display/hide its location on the map
Creek: Little Walnut Creek (A). Display/hide its location on the map
Parks in Urbandale include: Lions Park (1), Urbandale City Park (2), Walker-Johnson Park (3), Karen Acres (4), South Park (5), Northview Park (6), Living History Farms (7), Murphy Park (8). Display/hide their locations on the map
Tourist attractions: Living History Farms - Administration (Museums; 2600 111th Street) (1), Urbandale Historical Society (Historical Places & Services; 4010 70th Street) (2), Cruise One (Amusement & Theme Parks; 15419 Oakwood Drive) (3), Aristocrat Inc (Arcades & Amusements; 3209 86th Street) (4). Display/hide their approximate locations on the map
Hotels: Days Inn Merle Hay (4845 Merle Hay Road) (1), Timberline Cottages (12720 Sunflower Drive) (2), Suite Options Corporate Housing (3201 99th Street) (3), Extended Stay America (3940 114th St) (4), Comfort Suites (11167 Hickman Road) (5), Comfort Suites At Living History Farms (11167 Hickman Road) (6), Four Points By Sheraton Des Moines North (4800 Merle Hay Road) (7), Econo Lodge West (11000 Douglas Avenue) (8), Sleep Inn Urbandale (11211 Hickman Road) (9). Display/hide their approximate locations on the map
Birthplace of: Eddie Berlin - 2005 NFL player (Chicago Bears, born: Jan 14, 1978), Neil Clark Warren - Ispirational speaker, Brian Lillis - College basketball player (Albany Great Danes), Tyler McKinney - College basketball player (Creighton Bluejays).
| This city: | 2.5 people |
| Iowa: | 2.4 people |
| This city: | 69.3% |
| Whole state: | 64.7% |
| This city: | 4.8% |
| Whole state: | 6.7% |
Likely homosexual households (counted as self-reported same-sex unmarried-partner households)
- Lesbian couples: 0.3% of all households
- Gay men: 0.3% of all households
People in group quarters in Urbandale in 2010:
- 222 people in nursing facilities/skilled-nursing facilities
- 8 people in group homes for juveniles (non-correctional)
- 4 people in group homes intended for adults
People in group quarters in Urbandale in 2000:
- 252 people in nursing homes
- 36 people in other noninstitutional group quarters
- 16 people in homes for the mentally retarded
Banks with most branches in Urbandale (2011 data):
- Bank of America, National Association: Meredith Branch at 8525 Meredith Drive, branch established on 1993/08/09; Aurora Branch at 6200 Aurora Avenue, branch established on 1895/05/02. Info updated 2009/11/18: Bank assets: $1,451,969.3 mil, Deposits: $1,077,176.8 mil, headquarters in Charlotte, NC, positive income, 5782 total offices, Holding Company: Bank Of America Corporation
- Wells Fargo Bank, National Association: Urbandale Branch at 8301 Douglas Avenue, branch established on 1973/05/25. Info updated 2011/04/05: Bank assets: $1,161,490.0 mil, Deposits: $905,653.0 mil, headquarters in Sioux Falls, SD, positive income, 6395 total offices, Holding Company: Wells Fargo & Company
- Liberty Bank, F.S.B.: Urbandale Branch at 3800 100th Street, branch established on 2000/06/05. Info updated 2011/07/21: Bank assets: $934.1 mil, Deposits: $843.6 mil, headquarters in West Des Moines, IA, negative income in the last year, Commercial Lending Specialization, 27 total offices
- Iowa State Bank: Hickman Office at 2301 128th Street, branch established on 2006/03/15. Info updated 2006/11/03: Bank assets: $311.1 mil, Deposits: $262.2 mil, headquarters in Des Moines, IA, positive income, Commercial Lending Specialization, 5 total offices, Holding Company: Iowa State Bank Holding Company
- Midwest Heritage Bank, FSB: Urbandale Branch at 8601 Douglas Avenue, branch established on 1999/07/01. Info updated 2011/07/21: Bank assets: $154.4 mil, Deposits: $128.8 mil, headquarters in West Des Moines, IA, positive income, 9 total offices
- U.S. Bank National Association: Urbandale Branch at 3501 Northwest 86th Street, branch established on 1992/12/07. Info updated 2012/01/30: Bank assets: $330,470.8 mil, Deposits: $236,091.5 mil, headquarters in Cincinnati, OH, positive income, 3121 total offices, Holding Company: U.S. Bancorp
- Regions Bank: Urbandale Branch at 2851 86th Street, branch established on 1995/03/06. Info updated 2011/02/24: Bank assets: $123,368.2 mil, Deposits: $98,301.3 mil, headquarters in Birmingham, AL, positive income, Commercial Lending Specialization, 1778 total offices, Holding Company: Regions Financial Corporation
- Bank of the West: Urbandale at 8300 Douglas, branch established on 1916/01/01. Info updated 2009/11/16: Bank assets: $62,408.3 mil, Deposits: $43,995.2 mil, headquarters in San Francisco, CA, positive income, 647 total offices, Holding Company: Bnp Paribas
- West Bank: Urbandale Branch at 3255 99th Street, branch established on 1999/06/14. Info updated 2006/11/03: Bank assets: $1,256.9 mil, Deposits: $959.3 mil, headquarters in West Des Moines, IA, positive income, Commercial Lending Specialization, 12 total offices, Holding Company: West Bancorporation, Inc.
- 4 other banks with 4 local branches
For population 15 years and over in Urbandale:
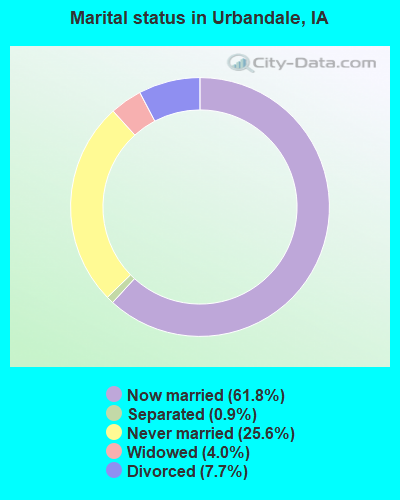
- Never married: 25.6%
- Now married: 61.8%
- Separated: 0.9%
- Widowed: 4.0%
- Divorced: 7.7%
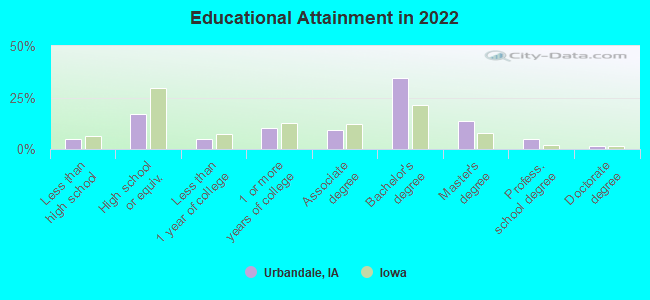
For population 25 years and over in Urbandale:
- High school or higher: 95.3%
- Bachelor's degree or higher: 51.9%
- Graduate or professional degree: 17.7%
- Unemployed: 2.3%
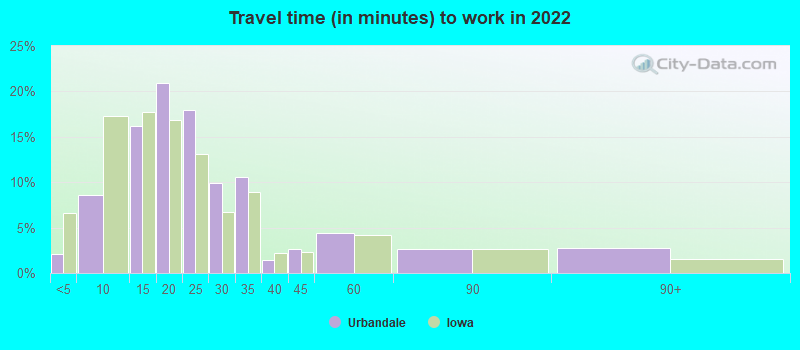
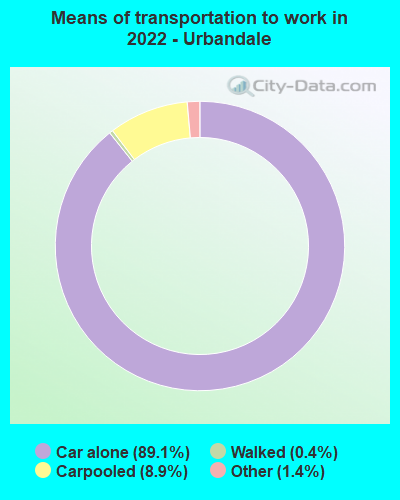
- Mean travel time to work (commute): 16.3 minutes
| Here: | 10.9 |
| Iowa average: | 10.5 |
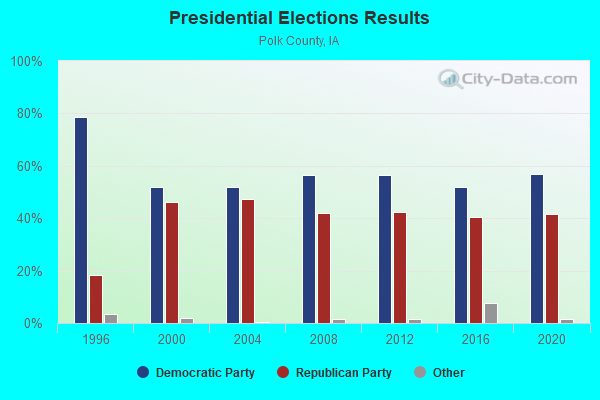
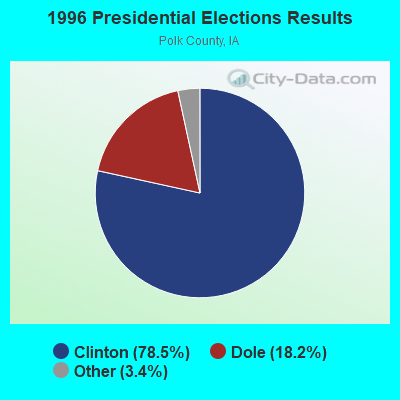
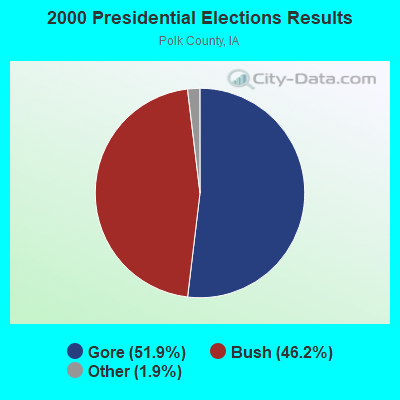
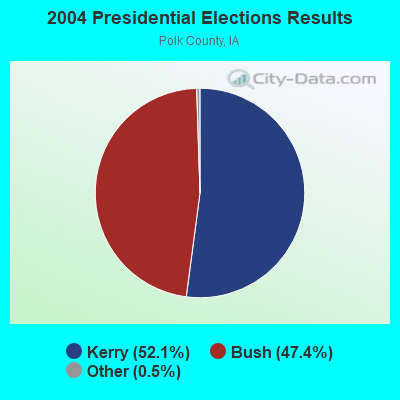
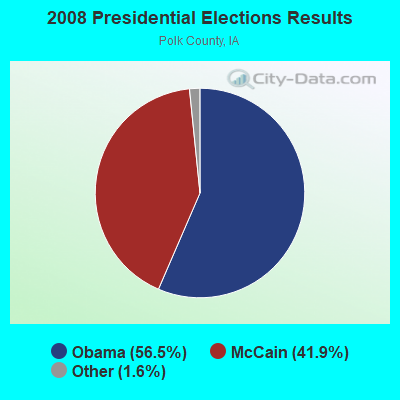

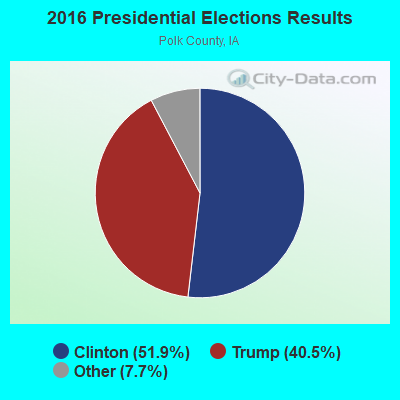
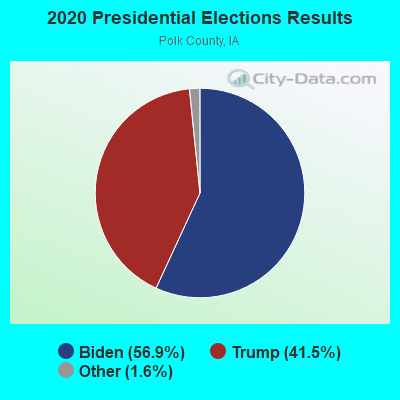
Graphs represent county-level data. Detailed 2008 Election Results
Neighborhoods in Urbandale:
(Urbandale, Iowa Neighborhood Map)- Alpine Village Plat neighborhood
- Ashland Park neighborhood
- Aurora Park neighborhood
- Bestland Estates neighborhood
- Bishop Place neighborhood
- Brook Ridge neighborhood
- Burnstedt neighborhood
- Charleston Court neighborhood
- Clear View neighborhood
- Clements Knolls neighborhood
- Clover Acres neighborhood
- Cobblestone neighborhood
- Colby Urbandale neighborhood
- Colby Woods neighborhood
- Corn Belt Acres neighborhood
- Coronado neighborhood
- Country View Estates neighborhood
- Cross Creek neighborhood
- Crossroads neighborhood
- Crystal Creek neighborhood
- Davisson Heights neighborhood
- Deer Creek neighborhood
- Deer Ridge neighborhood
- Douglas Park neighborhood
- Erickson Heights neighborhood
- Foxdale neighborhood
- Franklin Park neighborhood
- Glen Eagles neighborhood
- Golf View Estates neighborhood
- Hickman Heights neighborhood
- Hickory Hill neighborhood
- Holly "J" Manor neighborhood
- Interstate Acres neighborhood
- Iowa Interstate One neighborhood
- Jensen Manor neighborhood
- Karen Acres neighborhood
- Kingswood neighborhood
- Lake Halice Plat neighborhood
- Lookout Heights neighborhood
- Macrae Highlands neighborhood
- Maryland Acres neighborhood
- Mefferd Acres neighborhood
- Meredith Grande neighborhood
- Meredith Hills neighborhood
- Meredith Park neighborhood
- Northview Estates neighborhood
- Northwest Country Club Manor neighborhood
- Northwood neighborhood
- Oak Brook neighborhood
- Olmsted Place neighborhood
- Orchard View neighborhood
- Parkview neighborhood
- Patricia Park neighborhood
- Plaza Gardens neighborhood
- Plaza Hills neighborhood
- Quail Ridge neighborhood
- Richards Park neighborhood
- Rocklyn neighborhood
- Rolling Green neighborhood
- Scott's Park neighborhood
- Sharon Heights neighborhood
- Stoneridge Hills neighborhood
- Stuart Hills neighborhood
- Suburban Farms neighborhood
- Sunflower neighborhood
- Sungold neighborhood
- Sylvan Ridge neighborhood
- Talley Acres neighborhood
- The Meadows neighborhood
- The Woods neighborhood
- Thurman Place neighborhood
- Timber Glen neighborhood
- Timber View neighborhood
- Timberline neighborhood
- Timberline Village neighborhood
- Urbandale neighborhood
- Urbandale Knolls neighborhood
- Urbandale Marketplace neighborhood
- Walnut Ridge Business Park neighborhood
- Waters Edge neighborhood
- Westmark Plaza neighborhood
- Westover neighborhood
- Westport Ridge neighborhood
- Westwind neighborhood
- White Hall Acres neighborhood
- Wilshire Manor neighborhood
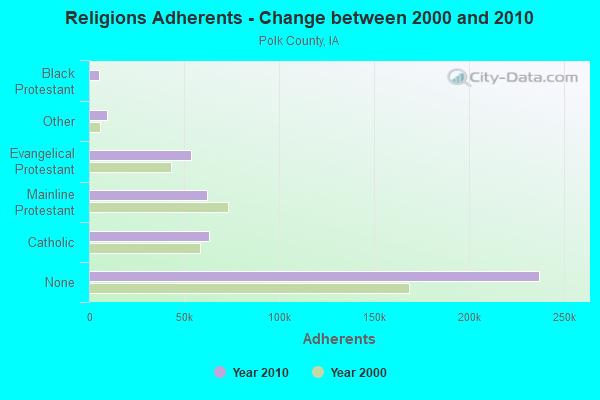
Religion statistics for Urbandale, IA (based on Polk County data)
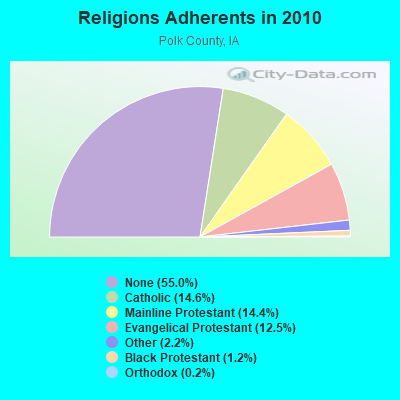
| Religion | Adherents | Congregations |
|---|---|---|
| Catholic | 62,867 | 19 |
| Mainline Protestant | 61,821 | 117 |
| Evangelical Protestant | 53,822 | 208 |
| Other | 9,331 | 35 |
| Black Protestant | 5,275 | 19 |
| Orthodox | 646 | 4 |
| None | 236,878 | - |
Food Environment Statistics:
| Polk County: | 1.51 / 10,000 pop. |
| Iowa: | 2.14 / 10,000 pop. |
| Polk County: | 0.17 / 10,000 pop. |
| Iowa: | 0.23 / 10,000 pop. |
| This county: | 0.19 / 10,000 pop. |
| Iowa: | 0.43 / 10,000 pop. |
| This county: | 3.78 / 10,000 pop. |
| Iowa: | 5.55 / 10,000 pop. |
| Here: | 7.57 / 10,000 pop. |
| Iowa: | 8.01 / 10,000 pop. |
| Polk County: | 7.3% |
| Iowa: | 7.8% |
| This county: | 25.8% |
| State: | 27.3% |
| This county: | 13.5% |
| Iowa: | 14.5% |
Health and Nutrition:
| This city: | 50.7% |
| Iowa: | 49.5% |
| Urbandale: | 48.4% |
| Iowa: | 46.1% |
| This city: | 28.7 |
| State: | 28.6 |
| This city: | 21.2% |
| Iowa: | 21.4% |
| Here: | 9.8% |
| Iowa: | 10.4% |
| Here: | 6.8 |
| Iowa: | 6.8 |
| Urbandale: | 35.4% |
| State: | 33.8% |
| Urbandale: | 57.4% |
| Iowa: | 55.9% |
| Urbandale: | 79.0% |
| Iowa: | 77.7% |
More about Health and Nutrition of Urbandale, IA Residents
| Local government employment and payroll (March 2022) | |||||
| Function | Full-time employees | Monthly full-time payroll | Average yearly full-time wage | Part-time employees | Monthly part-time payroll |
|---|---|---|---|---|---|
| Firefighters | 55 | $370,823 | $80,907 | 7 | $16,416 |
| Police Protection - Officers | 54 | $413,756 | $91,946 | 0 | $0 |
| Streets and Highways | 33 | $207,688 | $75,523 | 0 | $0 |
| Parks and Recreation | 21 | $126,175 | $72,100 | 1 | $1,063 |
| Other and Unallocable | 14 | $92,074 | $78,921 | 0 | $0 |
| Local Libraries | 11 | $63,396 | $69,159 | 31 | $50,468 |
| Other Government Administration | 10 | $87,021 | $104,425 | 7 | $4,345 |
| Police - Other | 9 | $41,824 | $55,765 | 0 | $0 |
| Financial Administration | 8 | $62,792 | $94,188 | 1 | $1,592 |
| Solid Waste Management | 7 | $44,180 | $75,737 | 0 | $0 |
| Sewerage | 6 | $36,857 | $73,714 | 0 | $0 |
| Housing and Community Development (Local) | 6 | $50,584 | $101,168 | 0 | $0 |
| Fire - Other | 1 | $3,956 | $47,472 | 2 | $2,684 |
| Totals for Government | 235 | $1,601,126 | $81,760 | 49 | $76,568 |
Urbandale government finances - Expenditure in 2021 (per resident):
- Construction - Water Utilities: $1,321,000 ($28.32)
- Current Operations - Water Utilities: $19,304,000 ($413.82)
Police Protection: $9,686,000 ($207.64)
Local Fire Protection: $7,526,000 ($161.34)
Regular Highways: $5,787,000 ($124.06)
Parks and Recreation: $4,948,000 ($106.07)
General - Other: $3,042,000 ($65.21)
Libraries: $2,584,000 ($55.39)
Solid Waste Management: $2,562,000 ($54.92)
Central Staff Services: $1,543,000 ($33.08)
Financial Administration: $981,000 ($21.03)
Housing and Community Development: $820,000 ($17.58)
Sewerage: $667,000 ($14.30)
General Public Buildings: $632,000 ($13.55)
Public Welfare - Other: $164,000 ($3.52)
Health - Other: $134,000 ($2.87)
Judicial and Legal Services: $127,000 ($2.72)
Miscellaneous Commercial Activities - Other: $26,000 ($0.56)
- General - Interest on Debt: $2,671,000 ($57.26)
- Intergovernmental to Local - Other - General - Other: $2,230,000 ($47.80)
- Other Capital Outlay - Sewerage: $12,000 ($0.26)
- Total Salaries and Wages: $20,000,000 ($428.74)
- Water Utilities - Interest on Debt: $34,000 ($0.73)
Urbandale government finances - Revenue in 2021 (per resident):
- Charges - Solid Waste Management: $2,781,000 ($59.62)
Sewerage: $2,370,000 ($50.81)
Other: $1,987,000 ($42.60)
Parks and Recreation: $89,000 ($1.91)
Miscellaneous Commercial Activities: $34,000 ($0.73)
- Federal Intergovernmental - Other: $2,205,000 ($47.27)
- Local Intergovernmental - Other: $224,000 ($4.80)
- Miscellaneous - Special Assessments: $773,000 ($16.57)
Interest Earnings: $549,000 ($11.77)
General Revenue - Other: $421,000 ($9.03)
Fines and Forfeits: $139,000 ($2.98)
Rents: $114,000 ($2.44)
- Revenue - Water Utilities: $22,269,000 ($477.38)
- State Intergovernmental - Highways: $6,354,000 ($136.21)
General Local Government Support: $996,000 ($21.35)
Other: $133,000 ($2.85)
- Tax - Property: $42,390,000 ($908.72)
General Sales and Gross Receipts: $7,850,000 ($168.28)
Other License: $1,523,000 ($32.65)
Public Utilities Sales: $1,445,000 ($30.98)
Other Selective Sales: $1,220,000 ($26.15)
Urbandale government finances - Debt in 2021 (per resident):
- Long Term Debt - Beginning Outstanding - Unspecified Public Purpose: $83,471,000 ($1789.38)
Outstanding Unspecified Public Purpose: $76,614,000 ($1642.39)
Retired Unspecified Public Purpose: $15,957,000 ($342.07)
Issue, Unspecified Public Purpose: $9,100,000 ($195.08)
Beginning Outstanding - Public Debt for Private Purpose: $4,901,000 ($105.06)
Outstanding Nonguaranteed - Industrial Revenue: $4,656,000 ($99.81)
Retired Nonguaranteed - Public Debt for Private Purpose: $245,000 ($5.25)
Urbandale government finances - Cash and Securities in 2021 (per resident):
- Bond Funds - Cash and Securities: $37,412,000 ($802.01)
- Other Funds - Cash and Securities: $77,510,000 ($1661.59)
- Sinking Funds - Cash and Securities: $4,881,000 ($104.63)
| Businesses in Urbandale, IA | ||||
| Name | Count | Name | Count | |
|---|---|---|---|---|
| Arby's | 3 | MasterBrand Cabinets | 9 | |
| AutoZone | 1 | Mazda | 1 | |
| BMW | 1 | McDonald's | 1 | |
| Big O Tires | 1 | Microtel | 1 | |
| Chevrolet | 1 | Nike | 1 | |
| Comfort Suites | 1 | Panera Bread | 1 | |
| Curves | 1 | Pizza Hut | 1 | |
| DHL | 1 | Quiznos | 1 | |
| Dairy Queen | 1 | Ruby Tuesday | 1 | |
| Decora Cabinetry | 1 | Sears | 1 | |
| Domino's Pizza | 1 | Sleep Inn | 1 | |
| Extended Stay America | 1 | Starbucks | 2 | |
| FedEx | 8 | Subaru | 1 | |
| GameStop | 1 | Subway | 2 | |
| Goodwill | 1 | Super 8 | 1 | |
| H&R Block | 2 | T-Mobile | 1 | |
| Haworth | 1 | Target | 1 | |
| Home Depot | 1 | U.S. Cellular | 5 | |
| IHOP | 1 | UPS | 16 | |
| Jones New York | 1 | Vans | 1 | |
| Kmart | 1 | Walgreens | 2 | |
| Long John Silver's | 1 | Wendy's | 1 | |
Strongest AM radio stations in Urbandale:
- WHO (1040 AM; 50 kW; DES MOINES, IA; Owner: CITICASTERS LICENSES, L.P.)
- KBGG (1700 AM; 10 kW; DES MOINES, IA; Owner: CITADEL BROADCASTING COMPANY)
- KRNT (1350 AM; 5 kW; DES MOINES, IA; Owner: SAGA COMMUNICATIONS OF IOWA, LLC)
- KXNO (1460 AM; 5 kW; DES MOINES, IA; Owner: CAPSTAR TX LIMITED PARTNERSHIP)
- KPSZ (940 AM; 10 kW; DES MOINES, IA; Owner: SAGA COMMUNICATIONS OF IOWA, LLC)
- WOI (640 AM; 5 kW; AMES, IA; Owner: IOWA STATE UNIV., OF SCIENCE & TECH.)
- KWKY (1150 AM; 1 kW; DES MOINES, IA; Owner: PUTBRESE COMMUNICATIONS, LTD.)
- KXEL (1540 AM; 50 kW; WATERLOO, IA; Owner: KXEL BROADCASTING COMPANY, INC.)
- KFGQ (1260 AM; 5 kW; BOONE, IA; Owner: BOONE BIBLICAL MINISTRIES, INC.)
- KOIL (1020 AM; 50 kW; PLATTSMOUTH, NE; Owner: WAITT RADIO, INC.)
- KFAB (1110 AM; 50 kW; OMAHA, NE; Owner: CAPSTAR TX LIMITED PARTNERSHIP)
- KKAR (1290 AM; 50 kW; OMAHA, NE; Owner: WAITT RADIO, INC.)
- WHB (810 AM; 50 kW; KANSAS CITY, MO; Owner: UNION BROADCASTING, INC.)
Strongest FM radio stations in Urbandale:
- KJJY (92.5 FM; WEST DES MOINES, IA; Owner: CITADEL BROADCASTING COMPANY)
- KHKI (97.3 FM; DES MOINES, IA; Owner: CITADEL BROADCASTING COMPANY)
- KIOA (93.3 FM; DES MOINES, IA; Owner: SAGA COMMUNICATIONS OF IOWA, LLC)
- KMXD (100.3 FM; DES MOINES, IA; Owner: CITICASTERS LICENSES, L.P.)
- WOI-FM (90.1 FM; AMES, IA; Owner: IOWA STATE UNIVERSITY OF SCI & TECH)
- KSTZ (102.5 FM; DES MOINES, IA; Owner: SAGA COMMUNICATIONS OF IOWA, LLC)
- KWDM (88.7 FM; WEST DES MOINES, IA; Owner: W. DES MOINES COMM. SCHOOL DISTRICT)
- KGGO (94.9 FM; DES MOINES, IA; Owner: CITADEL BROADCASTING COMPANY)
- K269EJ (101.7 FM; DES MOINES, IA; Owner: UNIVERSITY OF NORTHERN IOWA)
- KJMC (89.3 FM; DES MOINES, IA; Owner: MINORITY COMMUNICATIONS, INC.)
- KAZR (103.3 FM; PELLA, IA; Owner: SAGA COMMUNICATIONS OF IOWA, LLC)
- KVJZ (106.3 FM; ANKENY, IA; Owner: CITICASTERS LICENSES, L.P.)
- KDFR (91.3 FM; DES MOINES, IA; Owner: FAMILY STATIONS, INC.)
- KLTI-FM (104.1 FM; AMES, IA; Owner: SAGA COMMUNICATIONS OF IOWA, LLC)
- KRKQ (98.3 FM; BOONE, IA; Owner: CITADEL BROADCASTING COMPANY)
- KKDM (107.5 FM; DES MOINES, IA; Owner: CLEAR CHANNEL BROADCASTING LICENSES, INC.)
- KLRX (96.1 FM; MADRID, IA; Owner: THOMAS H. BURKE, RECEIVER FOR LIFESTYLE COMMUNICATIONS CORP.)
- KZZQ (99.5 FM; WINTERSET, IA; Owner: POSITIVE IMPACT MEDIA, INC.)
- KDLS-FM (105.5 FM; PERRY, IA; Owner: PERRY BROADCASTING COMPANY)
- KKRF (107.9 FM; STUART, IA; Owner: COON VALLEY COMMUNICATIONS, INC.)
TV broadcast stations around Urbandale:
- K41DD (Channel 41; DES MOINES, IA; Owner: VENTANA TELEVISION, INC.)
- WOI-TV (Channel 5; AMES, IA; Owner: CAPITAL COMMUNICATIONS COMPANY, INC.)
- WBXF-CA (Channel 4; DES MOINES, IA; Owner: THE BOX WORLDWIDE LLC)
- KDIN-TV (Channel 11; DES MOINES, IA; Owner: IOWA PUBLIC BROADCASTING BOARD)
- KPWB-TV (Channel 23; AMES, IA; Owner: PAPPAS TELECASTING OF IOWA, L.L.C.)
- KDSM-TV (Channel 17; DES MOINES, IA; Owner: KDSM LICENSEE, LLC)
- KCCI (Channel 8; DES MOINES, IA; Owner: DES MOINES HEARST-ARGYLE TV, INC.)
- WHO-TV (Channel 13; DES MOINES, IA; Owner: NEW YORK TIMES MANAGEMENT SERVICES)
- KRPG-LP (Channel 43; DES MOINES, IA; Owner: TIGER EYE BROADCASTING CORPORATION)
- K29EA (Channel 29; DES MOINES, IA; Owner: TV-45, INC.)
- K46EY (Channel 46; DES MOINES, IA; Owner: TV-45, INC.)
- K48FZ (Channel 48; AMES, IA; Owner: TV-52, INC.)
- K56GD (Channel 56; AMES, IA; Owner: TV-45, INC.)
- KFPX (Channel 39; NEWTON, IA; Owner: PAXSON DES MOINES LICENSE, INC.)
- National Bridge Inventory (NBI) Statistics
- 52Number of bridges
- 814ft / 248mTotal length
- 881,469Total average daily traffic
- 152,174Total average daily truck traffic
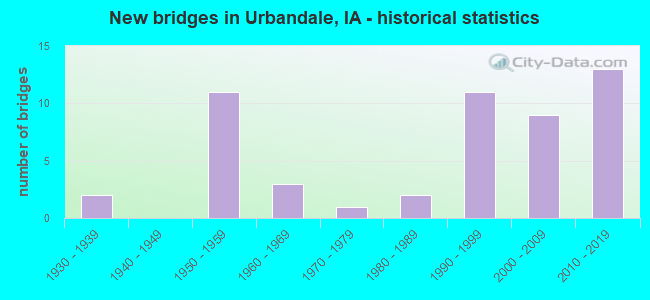
- New bridges - historical statistics
- 21930-1939
- 111950-1959
- 31960-1969
- 11970-1979
- 21980-1989
- 111990-1999
- 92000-2009
- 132010-2019
FCC Registered Antenna Towers: 30 (See the full list of FCC Registered Antenna Towers)
FCC Registered Commercial Land Mobile Towers: 3 (See the full list of FCC Registered Commercial Land Mobile Towers in Urbandale, IA)
FCC Registered Broadcast Land Mobile Towers: 21 (See the full list of FCC Registered Broadcast Land Mobile Towers)
FCC Registered Microwave Towers: 26 (See the full list of FCC Registered Microwave Towers in this town)
FCC Registered Amateur Radio Licenses: 146 (See the full list of FCC Registered Amateur Radio Licenses in Urbandale)
FAA Registered Aircraft Manufacturers and Dealers: 3 (See the full list of FAA Registered Manufacturers and Dealers in Urbandale)
FAA Registered Aircraft: 40 (See the full list of FAA Registered Aircraft)
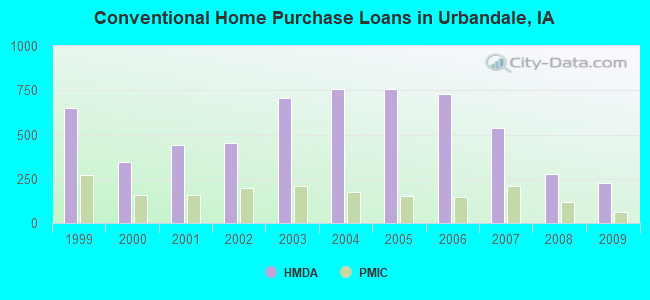
| Home Mortgage Disclosure Act Aggregated Statistics For Year 2009 (Based on 4 full and 1 partial tracts) | ||||||||||||
| A) FHA, FSA/RHS & VA Home Purchase Loans | B) Conventional Home Purchase Loans | C) Refinancings | D) Home Improvement Loans | F) Non-occupant Loans on < 5 Family Dwellings (A B C & D) | G) Loans On Manufactured Home Dwelling (A B C & D) | |||||||
|---|---|---|---|---|---|---|---|---|---|---|---|---|
| Number | Average Value | Number | Average Value | Number | Average Value | Number | Average Value | Number | Average Value | Number | Average Value | |
| LOANS ORIGINATED | 199 | $147,170 | 224 | $142,318 | 1,150 | $148,835 | 81 | $46,497 | 29 | $145,189 | 1 | $20,350 |
| APPLICATIONS APPROVED, NOT ACCEPTED | 8 | $159,470 | 8 | $155,338 | 116 | $148,048 | 10 | $41,605 | 1 | $89,900 | 1 | $14,940 |
| APPLICATIONS DENIED | 16 | $160,921 | 22 | $106,805 | 210 | $159,721 | 23 | $25,172 | 6 | $89,312 | 1 | $25,020 |
| APPLICATIONS WITHDRAWN | 14 | $129,938 | 14 | $129,764 | 206 | $155,705 | 14 | $35,861 | 5 | $129,138 | 0 | $0 |
| FILES CLOSED FOR INCOMPLETENESS | 4 | $187,595 | 1 | $372,500 | 24 | $153,061 | 0 | $0 | 0 | $0 | 0 | $0 |
Detailed HMDA statistics for the following Tracts: 0104.01 , 0104.03, 0104.04, 0104.05, 0113.00
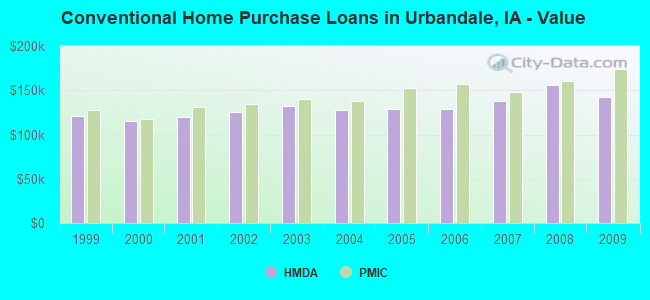
| Private Mortgage Insurance Companies Aggregated Statistics For Year 2009 (Based on 4 full and 1 partial tracts) | ||||||
| A) Conventional Home Purchase Loans | B) Refinancings | C) Non-occupant Loans on < 5 Family Dwellings (A & B) | ||||
|---|---|---|---|---|---|---|
| Number | Average Value | Number | Average Value | Number | Average Value | |
| LOANS ORIGINATED | 61 | $173,988 | 64 | $175,130 | 1 | $316,960 |
| APPLICATIONS APPROVED, NOT ACCEPTED | 6 | $189,577 | 11 | $173,474 | 0 | $0 |
| APPLICATIONS DENIED | 9 | $153,333 | 9 | $171,612 | 0 | $0 |
| APPLICATIONS WITHDRAWN | 2 | $175,325 | 3 | $224,787 | 0 | $0 |
| FILES CLOSED FOR INCOMPLETENESS | 0 | $0 | 1 | $184,280 | 0 | $0 |
Detailed PMIC statistics for the following Tracts: 0104.01 , 0104.03, 0104.04, 0104.05, 0113.00
2002 - 2017 National Fire Incident Reporting System (NFIRS) incidents
- Fire incident types reported to NFIRS in Urbandale, IA
- 62446.5%Structure Fires
- 38228.5%Outside Fires
- 26319.6%Mobile Property/Vehicle Fires
- 725.4%Other
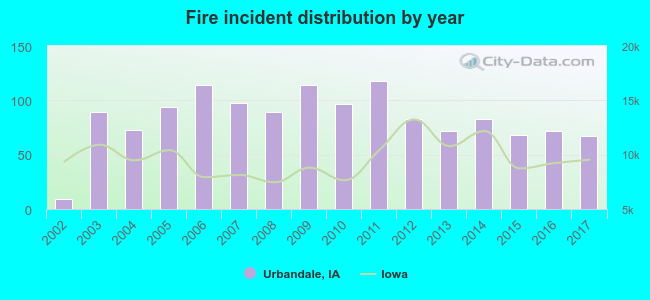 According to the data from the years 2002 - 2017 the average number of fires per year is 84. The highest number of reported fires - 118 took place in 2011, and the least - 9 in 2002. The data has a growing trend.
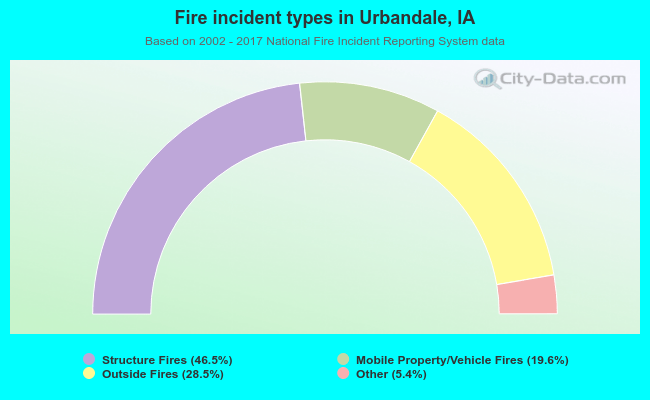 When looking into fire subcategories, the most reports belonged to: Structure Fires (46.5%), and Outside Fires (28.5%).
Fire-safe hotels and motels in Urbandale, Iowa:
- Super 8, 5900 Sutton Dr, Urbandale, Iowa 50322 , Phone: (515) 270-1037, Fax: (515) 270-1295
- Extended Stay America - Des Moines - Urbandale, 3940 114TH St, Urbandale, Iowa 50322 , Phone: (515) 276-1929, Fax: (515) 276-1565
- Sleep Inn @ Living History Farms, 11211 Hickman Rd, Urbandale, Iowa 50322 , Phone: (515) 270-2424, Fax: (515) 270-9114
- Holiday Inn Hotel & Suites, Des Moines Northwest, 4800 Merle Hay Rd, Urbandale, Iowa 50322 , Phone: (515) 278-4755, Fax: (515) 278-2846
- Hilton Garden Inn, 8600 Northpark Dr, Urbandale, Iowa 50322 , Phone: (515) 270-8890, Fax: (515) 727-4949
- Econolodge & Suites, 4755 Merle Hay Rd, Urbandale, Iowa 50322 , Phone: (515) 278-8858, Fax: (515) 974-5098
- Holiday Inn Express & Suites, 8200 Plum Dr, Urbandale, Iowa 50322 , Phone: (515) 278-9000, Fax: (515) 278-9100
- Fairfield Inn & Suites, 8661 Plum Dr, Urbandale, Iowa 50322 , Phone: (515) 278-2500, Fax: (515) 278-2550
- Hampton Inn and Suites Des Moines/Urbandale, 8811 Plum Dr, Urbandale, Iowa 50322 , Phone: (515) 252-7000, Fax: (515) 252-7300
| Most common first names in Urbandale, IA among deceased individuals | ||
| Name | Count | Lived (average) |
|---|---|---|
| Mary | 166 | 78.8 years |
| Robert | 129 | 71.5 years |
| John | 124 | 73.6 years |
| James | 93 | 72.1 years |
| William | 93 | 75.1 years |
| Helen | 74 | 82.1 years |
| Ruth | 66 | 80.2 years |
| Dorothy | 66 | 80.6 years |
| Charles | 61 | 77.6 years |
| Richard | 55 | 68.8 years |
| Most common last names in Urbandale, IA among deceased individuals | ||
| Last name | Count | Lived (average) |
|---|---|---|
| Smith | 62 | 75.9 years |
| Johnson | 44 | 75.5 years |
| Miller | 37 | 77.6 years |
| Wilson | 31 | 81.1 years |
| Brown | 30 | 72.2 years |
| Nelson | 28 | 71.0 years |
| Anderson | 26 | 75.9 years |
| Davis | 25 | 75.6 years |
| Peterson | 24 | 81.3 years |
| White | 20 | 73.8 years |
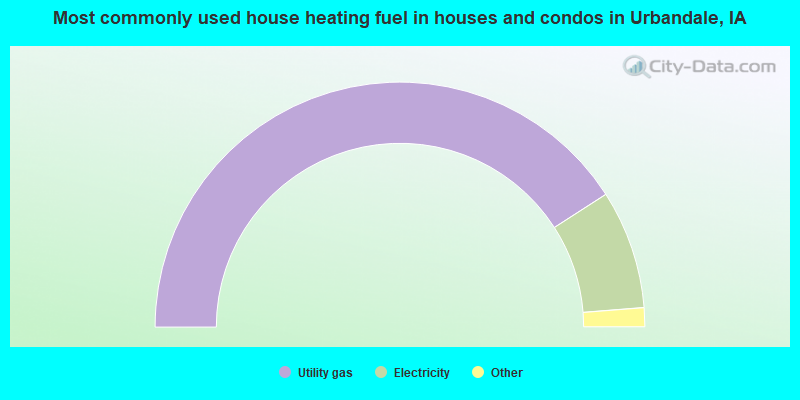
- 81.8%Utility gas
- 15.7%Electricity
- 2.1%Bottled, tank, or LP gas
- 0.2%Other fuel
- 0.1%No fuel used
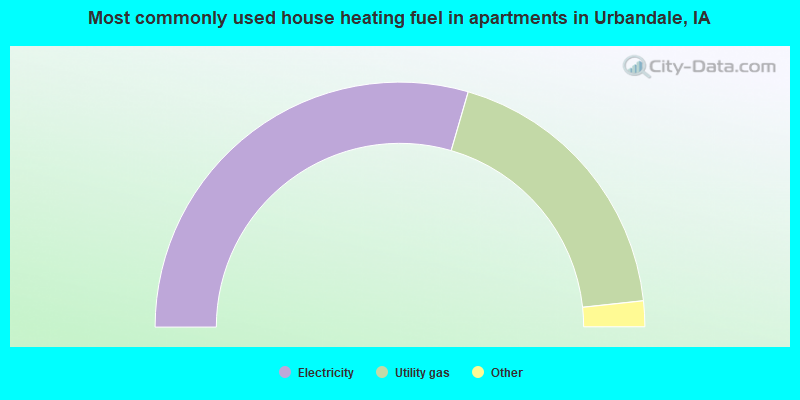
- 59.0%Electricity
- 37.6%Utility gas
- 2.7%No fuel used
- 0.4%Bottled, tank, or LP gas
- 0.2%Other fuel
Urbandale compared to Iowa state average:
- Median household income above state average.
- Median house value above state average.
- Unemployed percentage significantly below state average.
- Black race population percentage above state average.
- Median age below state average.
- Foreign-born population percentage significantly above state average.
- Length of stay since moving in significantly above state average.
- House age significantly below state average.
- Percentage of population with a bachelor's degree or higher significantly above state average.
Urbandale on our top lists:
- #10 on the list of "Top 101 cities with largest percentage of females in industries: finance and insurance (population 5,000+)"
- #21 on the list of "Top 101 cities with the most residents born in Bosnia and Herzegovina (population 500+)"
- #49 on the list of "Top 101 cities with largest percentage of males in industries: finance and insurance (population 5,000+)"
- #59 on the list of "Top 101 cities with the largest racial income disparity between any two races with at least 200 householders"
- #23 on the list of "Top 101 counties with the lowest Sulfur Oxides Annual air pollution readings in 2012 (µg/m3)"
- #30 on the list of "Top 101 counties with the lowest percentage of residents relocating from foreign countries between 2010 and 2011"
- #46 on the list of "Top 101 counties with the lowest percentage of residents relocating to foreign countries in 2011"
- #47 on the list of "Top 101 counties with the highest percentage of residents that visited a dentist within the past year"
- #55 on the list of "Top 101 counties with the most Mainline Protestant adherents"

|
|
Total of 483 patent applications in 2008-2024.