Woodburn, OR (Oregon) Houses and Residents
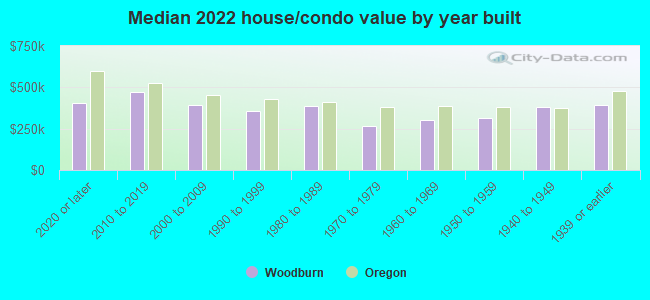
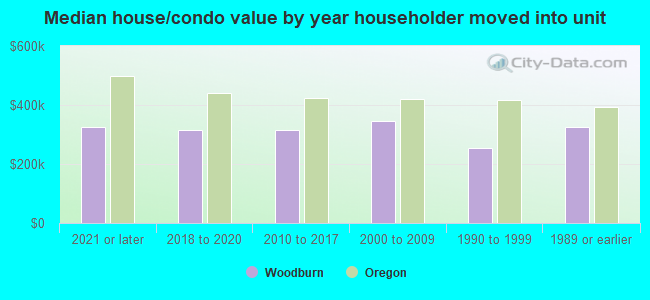
Estimated median house or condo value in 2022: $316,048 (it was $109,600 in 2000 )
Woodburn:
$316,048Oregon:
$475,600
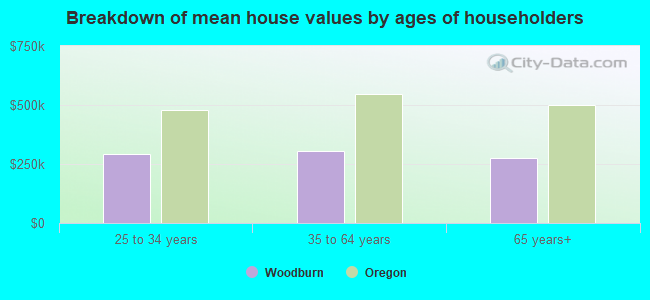
Lower value quartile - upper value quartile: $240,158 - $417,239Mean price in 2022: Detached houses: $290,718 Here:
$290,718State:
$562,872
Townhouses or other attached units: $381,843 Here:
$381,843State:
$463,029
In 5-or-more-unit structures: $168,638 Here:
$168,638State:
$420,389
Mobile homes: $87,832 Here:
$87,832State:
$214,044
Total population: 24,734 (Urban population: 20,076 (all inside urban clusters), Rural population: 0)
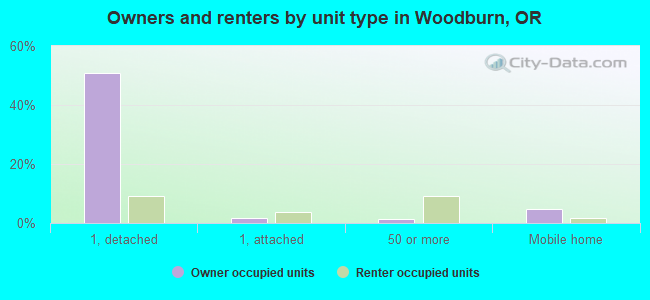
Houses: 9,325 (9,045 occupied: 6,066 owner occupied, 3,115 renter occupied )
% of renters here:
34%State:
37%
Housing density: 1,793 houses/condos per square mile
Median price asked for vacant for-sale houses and condos in 2022 in this county: $312,124.
Median contract rent in 2022: $1,121 (lower quartile is $937, upper quartile is $1,364)
Median rent asked for vacant for-rent units in 2022: $1,726
Median gross rent in Woodburn, OR in 2022: $1,349
Housing units in Woodburn with a mortgage: 3,958 (111 second mortgage, 1 home equity loan, 67 both second mortgage and home equity loan )Houses without a mortgage: 40
Median household income for houses/condos with a mortgage: $92,161
Median household income for apartments without a mortgage: $51,489
Median monthly housing costs: $1,250
Data:
Median house or condo value ($)
Median house or condo value ($ change since 2000)
Median house or condo value ($) - White
Median house or condo value ($) - Black or African American
Median house or condo value ($) - Asian
Median house or condo value ($) - Hispanic or Latino
Median house or condo value ($) - American Indian and Alaska Native
Median house or condo value ($) - Multirace
Median house or condo value ($) - Other Race
Median price asked for mobile homes ($)
Household density (households per square mile)
Mean house or condo value by units in structure - 1, detached ($)
Mean house or condo value by units in structure - 1, attached ($)
Mean house or condo value by units in structure - 2 ($)
Mean house or condo value by units in structure by units in structure - 3 or 4 ($)
Mean house or condo value by units in structure - 5 or more ($)
Mean house or condo value by units in structure - Boat, RV, van, etc. ($)
Mean house or condo value by units in structure - Mobile home ($)
Median contract rent ($)
Median contract rent - Lower quartile ($)
Median contract rent - Upper quartile ($)
Median gross rent ($)
Urban houses (%)
Rural houses (%)
Houses occupied (%)
Houses occupied (% change since 2000)
Houses owner occupied (%)
Houses owner occupied (% change since 2000)
Houses renter occupied (%)
Houses renter occupied (% change since 2000)
Vacant housing units - For rent (%)
Vacant housing units - For rent (% change since 2000)
Vacant housing units - For sale only (%)
Vacant housing units - For sale only (% change since 2000)
Vacant housing units - Rented or sold, not occupied (%)
Vacant housing units - Rented or sold, not occupied (% change since 2000)
Vacant housing units - For seasonal, recreational, or occasional use (%)
Vacant housing units - For seasonal, recreational, or occasional use (% change since 2000)
Vacant housing units - For migrant workers (%)
Vacant housing units - For migrant workers (% change since 2000)
Vacant housing units - Other vacant (%)
Vacant housing units - Other vacant (% change since 2000)
Median monthly housing costs ($)
Median household income for houses/condos with a mortgage ($)
Median household income for houses/condos without a mortgage ($)
Median household income ($)
Median household income ($) - White
Median household income ($) - Black or African American
Median household income ($) - Asian
Median household income ($) - Hispanic or Latino
Median household income ($) - American Indian and Alaska Native
Median household income ($) - Multirace
Median household income ($) - Other Race
Mortgage status - with mortgage (%)
Mortgage status - with second mortgage (%)
Mortgage status - with home equity loan (%)
Mortgage status - with both second mortgage and home equity loan (%)
Mortgage status - without a mortgage (%)
Median year house/condo built
Median year apartment built
Household type by relationship - Male householder living alone (%)
Household type by relationship - Male householder not living alone (%)
Household type by relationship - Female householder living alone (%)
Household type by relationship - Female householder not living alone (%)
Household type by relationship - Opposite-Sex spouse (%)
Household type by relationship - Same-Sex spouse (%)
Household type by relationship - Opposite-Sex unmarried partner (%)
Household type by relationship - Same-Sex unmarried partner (%)
Household type by relationship - In group quarters (%)
Size of family households - 2-person household (%)
Size of family households - 3-person household (%)
Size of family households - 4-person household (%)
Size of family households - 5-person household (%)
Size of family households - 6-person household (%)
Size of family households - 7-or-more-person household (%)
Size of nonfamily households - 1-person household (%)
Size of nonfamily households - 2-person household (%)
Size of nonfamily households - 3-person household (%)
Size of nonfamily households - 4-person household (%)
Size of nonfamily households - 5-person household (%)
Size of nonfamily households - 6-person household (%)
Size of nonfamily households - 7-or-moreperson household (%)
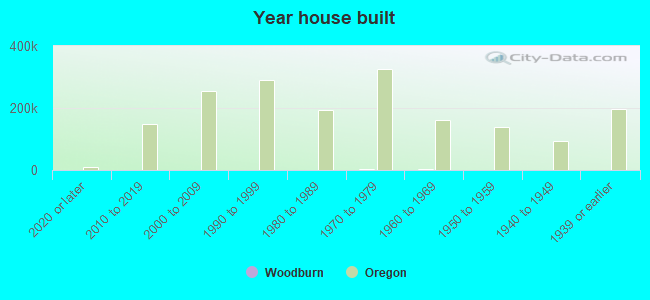
Year house built - Built 2010 or later (%)
Year house built - Built 2000 to 2009 (%)
Year house built - Built 1990 to 1999 (%)
Year house built - Built 1980 to 1989 (%)
Year house built - Built 1970 to 1979 (%)
Year house built - Built 1960 to 1969 (%)
Year house built - Built 1950 to 1959 (%)
Year house built - Built 1940 to 1949 (%)
Year house built - Built 1939 or earlier (%)
Median number of rooms in houses and condos
Median number of rooms in apartments
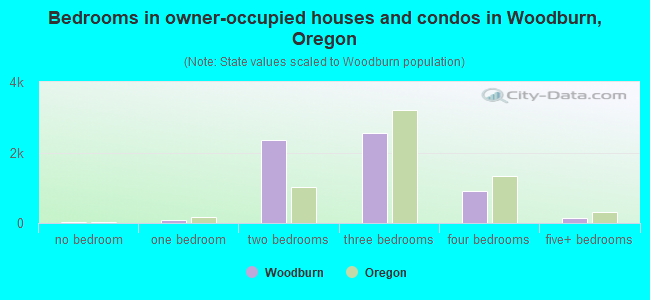
Median number of bedrooms in owner occupied houses
Mean number of bedrooms in owner occupied houses
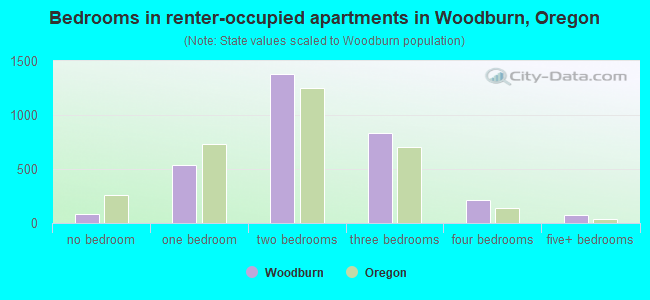
Median number of bedrooms in renter occupied houses
Mean number of bedrooms in renter occupied houses
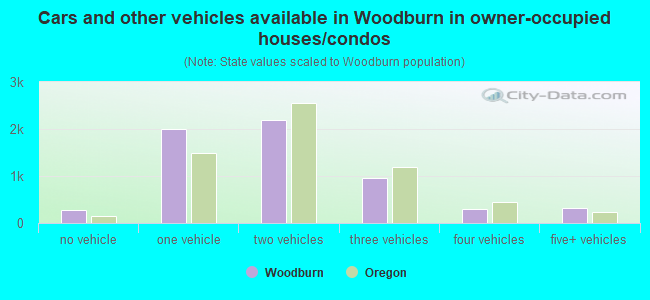
Median number of vehichles in owner occupied houses
Mean number of vehichles in owner occupied houses
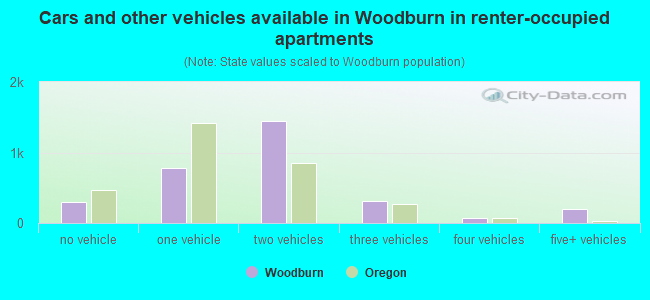
Median number of vehichles in renter occupied houses
Mean number of vehichles in renter occupied houses
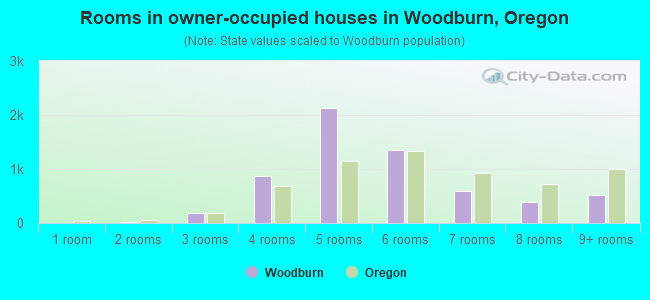
Rooms in owner-occupied houses - 1 room (%)
Rooms in owner-occupied houses - 2 rooms (%)
Rooms in owner-occupied houses - 3 rooms (%)
Rooms in owner-occupied houses - 4 rooms (%)
Rooms in owner-occupied houses - 5 rooms (%)
Rooms in owner-occupied houses - 6 rooms (%)
Rooms in owner-occupied houses - 7 rooms (%)
Rooms in owner-occupied houses - 8 rooms (%)
Rooms in owner-occupied houses - 9+ rooms (%)
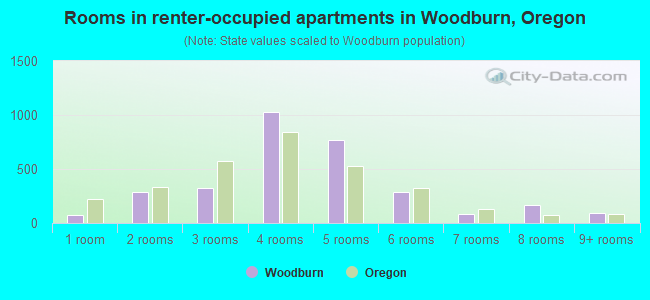
Rooms in renter-occupied houses - 1 room (%)
Rooms in renter-occupied houses - 2 rooms (%)
Rooms in renter-occupied houses - 3 rooms (%)
Rooms in renter-occupied houses - 4 rooms (%)
Rooms in renter-occupied houses - 5 rooms (%)
Rooms in renter-occupied houses - 6 rooms (%)
Rooms in renter-occupied houses - 7 rooms (%)
Rooms in renter-occupied houses - 8 rooms (%)
Rooms in renter-occupied houses - 9+ rooms (%)
Bedrooms in owner-occupied houses - no bedrooms (%)
Bedrooms in owner-occupied houses - 1 bedroom (%)
Bedrooms in owner-occupied houses - 2 bedrooms (%)
Bedrooms in owner-occupied houses - 3 bedrooms (%)
Bedrooms in owner-occupied houses - 4 bedrooms (%)
Bedrooms in owner-occupied houses - 5+ bedrooms (%)
Bedrooms in renter-occupied houses - no bedrooms (%)
Bedrooms in renter-occupied houses - 1 bedroom (%)
Bedrooms in renter-occupied houses - 2 bedrooms (%)
Bedrooms in renter-occupied houses - 3 bedrooms (%)
Bedrooms in renter-occupied houses - 4 bedrooms (%)
Bedrooms in renter-occupied houses - 5+ bedrooms (%)
Vehicles available in owner-occupied houses - no vehicle available (%)
Vehicles available in owner-occupied houses - 1 vehicle available(%)
Vehicles available in owner-occupied houses - 2 Vehicles available (%)
Vehicles available in owner-occupied houses - 3 Vehicles available (%)
Vehicles available in owner-occupied houses - 4 Vehicles available (%)
Vehicles available in owner-occupied houses - 5+ Vehicles available (%)
Vehicles available in renter-occupied houses - no vehicle available (%)
Vehicles available in renter-occupied houses - 1 vehicle available (%)
Vehicles available in renter-occupied houses - 2 Vehicles available (%)
Vehicles available in renter-occupied houses - 3 Vehicles available (%)
Vehicles available in renter-occupied houses - 4 Vehicles available (%)
Vehicles available in renter-occupied houses - 5+ Vehicles available (%)
Housing units in structures - 1, detached (%)
Housing units in structures - 1, attached (%)
Housing units in structures - 2 (%)
Housing units in structures - 3 or 4 (%)
Housing units in structures - 5 to 9 (%)
Housing units in structures - 10 to 19 (%)
Housing units in structures - 20 to 49 (%)
Housing units in structures - 50 or more (%)
Housing units in structures - Mobile home (%)
Housing units in structures - Boat, RV, van, etc. (%)
Housing units in structures - Owners - 1, detached (%)
Housing units in structures - Owners - 1, attached (%)
Housing units in structures - Owners - 2 (%)
Housing units in structures - Owners - 3 or 4 (%)
Housing units in structures - Owners - 5 to 9 (%)
Housing units in structures - Owners - 10 to 19 (%)
Housing units in structures - Owners - 20 to 49 (%)
Housing units in structures - Owners - 50 or more (%)
Housing units in structures - Owners - Mobile home (%)
Housing units in structures - Owners - Boat, RV, van, etc. (%)
Housing units in structures - Renters - 1, detached (%)
Housing units in structures - Renters - 1, attached (%)
Housing units in structures - Renters - 2 (%)
Housing units in structures - Renters - 3 or 4 (%)
Housing units in structures - Renters - 5 to 9 (%)
Housing units in structures - Renters - 10 to 19 (%)
Housing units in structures - Renters - 20 to 49 (%)
Housing units in structures - Renters - 50 or more (%)
Housing units in structures - Renters - Mobile home (%)
Housing units in structures - Renters - Boat, RV, van, etc. (%)
House/condo owner moved in on average (years ago)
Renter moved in on average (years ago)
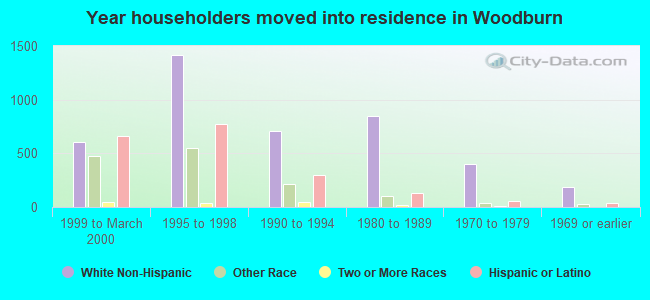
Year householder moved into unit - Moved in 1999 to March 2000 (%)
Year householder moved into unit - Moved in 1999 to March 2000 (%) - White
Year householder moved into unit - Moved in 1999 to March 2000 (%) - Black or African American
Year householder moved into unit - Moved in 1999 to March 2000 (%) - Asian
Year householder moved into unit - Moved in 1999 to March 2000 (%) - Hispanic or Latino
Year householder moved into unit - Moved in 1999 to March 2000 (%) - American Indian and Alaska Native
Year householder moved into unit - Moved in 1999 to March 2000 (%) - Multirace
Year householder moved into unit - Moved in 1999 to March 2000 (%) - Other Race
Year householder moved into unit - Moved in 1995 to 1998 (%)
Year householder moved into unit - Moved in 1995 to 1998 (%) - White
Year householder moved into unit - Moved in 1995 to 1998 (%) - Black or African American
Year householder moved into unit - Moved in 1995 to 1998 (%) - Asian
Year householder moved into unit - Moved in 1995 to 1998 (%) - Hispanic or Latino
Year householder moved into unit - Moved in 1995 to 1998 (%) - American Indian and Alaska Native
Year householder moved into unit - Moved in 1995 to 1998 (%) - Multirace
Year householder moved into unit - Moved in 1995 to 1998 (%) - Other Race
Year householder moved into unit - Moved in 1990 to 1994 (%)
Year householder moved into unit - Moved in 1990 to 1994 (%) - White
Year householder moved into unit - Moved in 1990 to 1994 (%) - Black or African American
Year householder moved into unit - Moved in 1990 to 1994 (%) - Asian
Year householder moved into unit - Moved in 1990 to 1994 (%) - Hispanic or Latino
Year householder moved into unit - Moved in 1990 to 1994 (%) - American Indian and Alaska Native
Year householder moved into unit - Moved in 1990 to 1994 (%) - Multirace
Year householder moved into unit - Moved in 1990 to 1994 (%) - Other Race
Year householder moved into unit - Moved in 1980 to 1989 (%)
Year householder moved into unit - Moved in 1980 to 1989 (%) - White
Year householder moved into unit - Moved in 1980 to 1989 (%) - Black or African American
Year householder moved into unit - Moved in 1980 to 1989 (%) - Asian
Year householder moved into unit - Moved in 1980 to 1989 (%) - Hispanic or Latino
Year householder moved into unit - Moved in 1980 to 1989 (%) - American Indian and Alaska Native
Year householder moved into unit - Moved in 1980 to 1989 (%) - Multirace
Year householder moved into unit - Moved in 1980 to 1989 (%) - Other Race
Year householder moved into unit - Moved in 1970 to 1979 (%)
Year householder moved into unit - Moved in 1970 to 1979 (%) - White
Year householder moved into unit - Moved in 1970 to 1979 (%) - Black or African American
Year householder moved into unit - Moved in 1970 to 1979 (%) - Asian
Year householder moved into unit - Moved in 1970 to 1979 (%) - Hispanic or Latino
Year householder moved into unit - Moved in 1970 to 1979 (%) - American Indian and Alaska Native
Year householder moved into unit - Moved in 1970 to 1979 (%) - Multirace
Year householder moved into unit - Moved in 1970 to 1979 (%) - Other Race
Year householder moved into unit - Moved in 1969 or earlier (%)
Year householder moved into unit - Moved in 1969 or earlier (%) - White
Year householder moved into unit - Moved in 1969 or earlier (%) - Black or African American
Year householder moved into unit - Moved in 1969 or earlier (%) - Asian
Year householder moved into unit - Moved in 1969 or earlier (%) - Hispanic or Latino
Year householder moved into unit - Moved in 1969 or earlier (%) - American Indian and Alaska Native
Year householder moved into unit - Moved in 1969 or earlier (%) - Multirace
Year householder moved into unit - Moved in 1969 or earlier (%) - Other Race
Housing units lacking complete plumbing facilities (%)
Housing units lacking complete kitchen facilities (%)
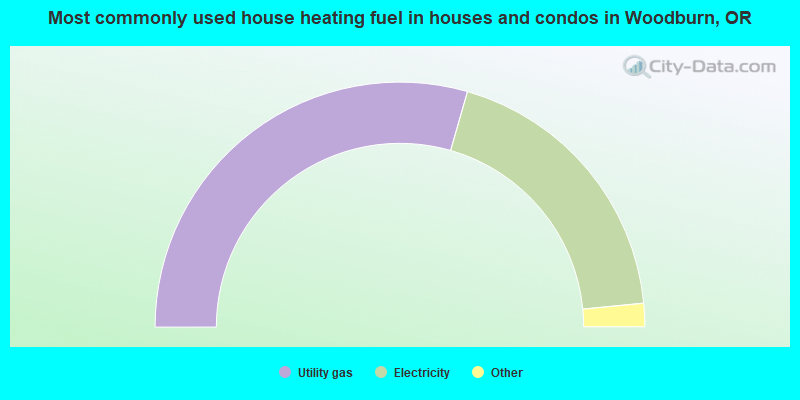
House heating fuel used in houses and condos - Utility gas (%)
House heating fuel used in houses and condos - Bottled, tank, or LP gas (%)
House heating fuel used in houses and condos - Electricity (%)
House heating fuel used in houses and condos - Fuel oil, kerosene, etc. (%)
House heating fuel used in houses and condos - Coal or coke (%)
House heating fuel used in houses and condos - Wood (%)
House heating fuel used in houses and condos - Solar energy (%)
House heating fuel used in houses and condos - Other fuel (%)
House heating fuel used in houses and condos - No fuel used (%)
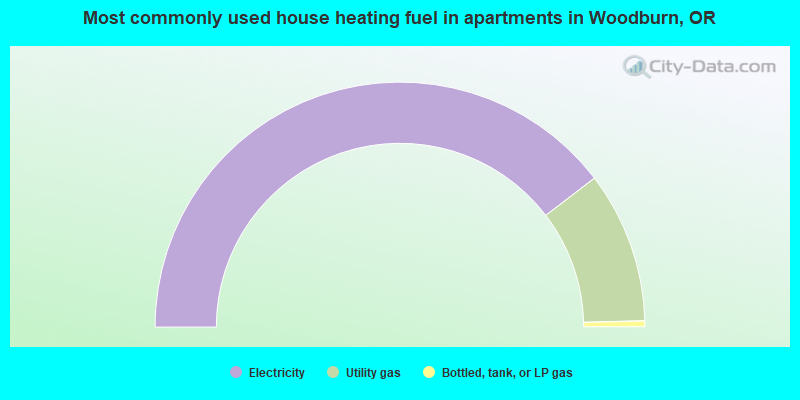
House heating fuel used in apartments - Utility gas (%)
House heating fuel used in apartments - Bottled, tank, or LP gas (%)
House heating fuel used in apartments - Electricity (%)
House heating fuel used in apartments - Fuel oil, kerosene, etc. (%)
House heating fuel used in apartments - Coal or coke (%)
House heating fuel used in apartments - Wood (%)
House heating fuel used in apartments - Solar energy (%)
House heating fuel used in apartments - Other fuel (%)
House heating fuel used in apartments - No fuel used (%)
Latest news about housing in Woodburn, OR collected exclusively by city-data.com from local newspapers, TV, and radio stations
Median year house/condo built: 1976Median year apartment built: 1978Household type by relationship:
Households: 26,289
Male householders: 4,356 (774 living alone ), Female householders: 4,505 (1,582 living alone )3,978 spouses (3,911 opposite-sex spouses ), 890 unmarried partners , (874 opposite-sex unmarried partners ), 8,491 children (7,858 natural , 68 adopted , 565 stepchildren ), 728 grandchildren , 610 brothers or sisters , 539 parents , 0 foster children , 814 other relatives , 1,136 non-relatives In group quarters: 237
Size of family households: 2,058 2-persons , 952 3-persons , 1,157 4-persons , 949 5-persons , 622 6-persons , 227 7-or-more-persons .
Size of nonfamily households: 2,568 1-person , 621 2-persons , 46 3-persons .
3,698 married couples with children. single-parent households (928 men , 898 women ).
43.7% of residents of Woodburn speak English at home. of residents speak Spanish at home (46% speak English very well , 19% speak English well , 16% speak English not well , 19% don't speak English at all ).of residents speak other Indo-European language at home (81% speak English very well , 8% speak English well , 9% speak English not well , 1% don't speak English at all ).of residents speak Asian or Pacific Island language at home (21% speak English very well , 22% speak English well , 20% speak English not well , 37% don't speak English at all ).of residents speak other language at home (8% speak English very well , 23% speak English well , 17% speak English not well , 51% don't speak English at all ).
Foreign born population: 8,851 (33.7%)of them are naturalized citizens )
Median number of rooms in houses and condos:
Median number of rooms in apartments
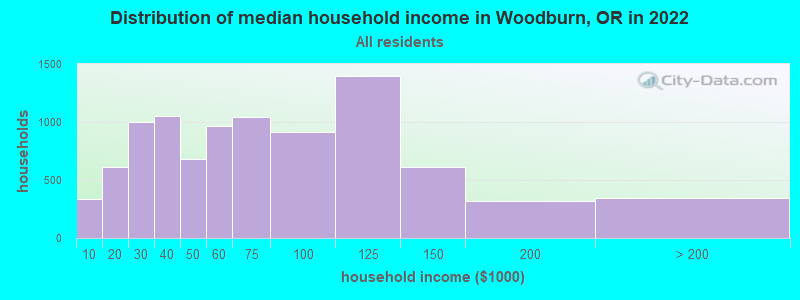
Woodburn, OR household income distribution 332 Less than $10,000615 $10,000 to $19,999998 $20,000 to $29,9991,052 $30,000 to $39,999678 $40,000 to $49,999965 $50,000 to $59,9991,044 $60,000 to $74,999918 $75,000 to $99,9991,396 $100,000 to $124,999611 $125,000 to $149,999320 $150,000 to $199,999348 $200,000 or more
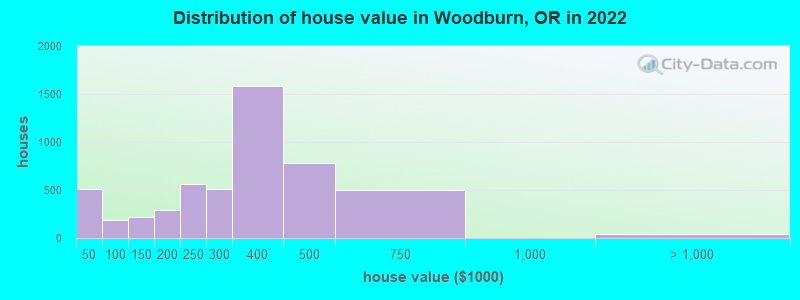
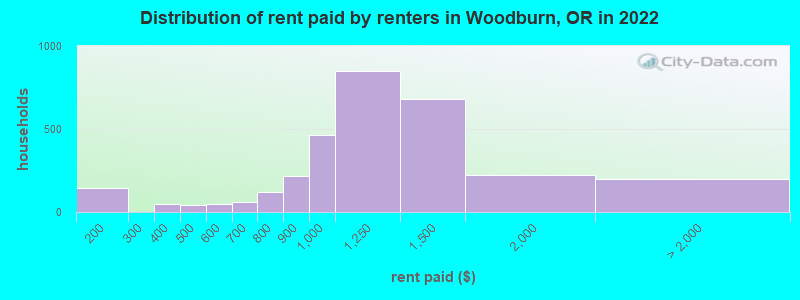
Home value of owner - occupied houses in 2022 in Woodburn, OR 156 Less than $10,00022 $20,000 to $24,999131 $25,000 to $29,99962 $30,000 to $34,99911 $35,000 to $39,999129 $40,000 to $49,99927 $50,000 to $59,99934 $90,000 to $99,999133 $100,000 to $124,99987 $125,000 to $149,999145 $150,000 to $174,999141 $175,000 to $199,999559 $200,000 to $249,999507 $250,000 to $299,9991,579 $300,000 to $399,999780 $400,000 to $499,999499 $500,000 to $749,9992 $750,000 to $999,99941 $1,500,000 to $1,999,999Rent paid by renters in 2022 in Woodburn, OR 26 $100 to $149121 $150 to $1990 $250 to $29945 $300 to $34940 $400 to $44946 $550 to $59933 $600 to $64927 $650 to $69939 $700 to $74981 $750 to $799218 $800 to $899462 $900 to $999851 $1,000 to $1,249682 $1,250 to $1,499220 $1,500 to $1,99923 $2,000 to $2,49989 $2,500 to $2,99937 $3,000 to $3,49925 $3,500 or more21 No cash rent
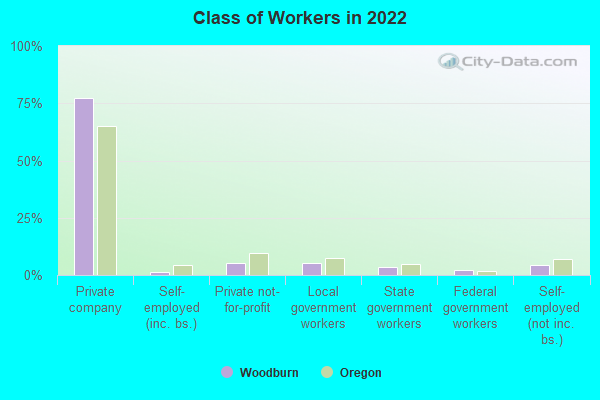
Percentage of workers working in this county: 60.3%Number of people working at home: 1,492 (12.9% of all workers )
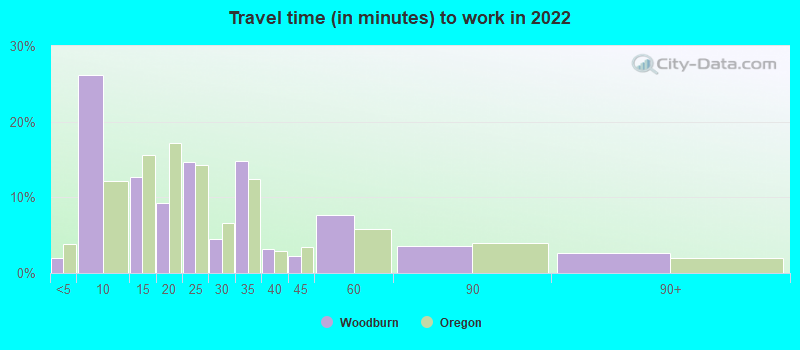
Travel time to work (commute)
Less than 5 minutes: 935 to 9 minutes: 1,76810 to 14 minutes: 1,44315 to 19 minutes: 68920 to 24 minutes: 96725 to 29 minutes: 75130 to 34 minutes: 1,72935 to 39 minutes: 43140 to 44 minutes: 92345 to 59 minutes: 66160 to 89 minutes: 78590 or more minutes: 123
Means of transportation to work:
Drove a car alone: 6,783 (71.2%)Carpooled: 1,171 (12.3%)Bus : 64 (0.7%)Taxi: 94 (1.0%)Bicycle: 14 (0.1%)Walked: 42 (0.4%)Worked at home: 1,492 (15.7%)
Unemployment by race in 2022
Unemployment rate for White non-Hispanic residents 4.0% Males7.8% FemalesUnemployment rate for Black residents 100.0% MalesUnemployment rate for Asian residents 2.5% FemalesUnemployment rate for other race residents 0.3% Males10.3% FemalesUnemployment rate for two or more race residents 0.4% FemalesUnemployment rate for Hispanic or Latino residents 0.2% Males5.4% Females
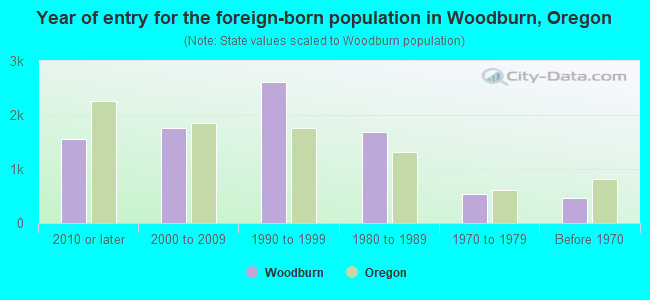
Year of entry for the foreign-born population in Woodburn, Oregon
1,551 2010 or later 1,751 2000 to 2009 2,607 1990 to 1999 1,691 1980 to 1989 535 1970 to 1979 469 Before 1970
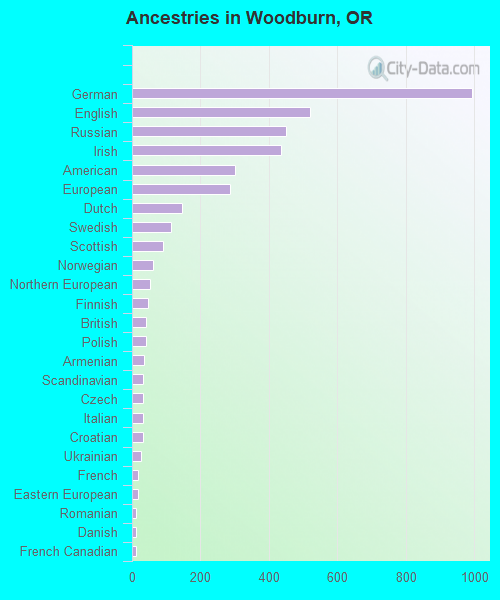
First ancestries reported:
German: 994 (5.5%)
English: 519 (2.9%)
Russian: 451 (2.5%)
Irish: 437 (2.4%)
American: 302 (1.7%)
European: 287 (1.6%)
Dutch: 146 (0.8%)
Swedish: 113 (0.6%)
Scottish: 90 (0.5%)
Norwegian: 62 (0.3%)
Northern European: 54 (0.3%)
Finnish: 46 (0.3%)
British: 40 (0.2%)
Polish: 40 (0.2%)
Armenian: 34 (0.2%)
Scandinavian: 33 (0.2%)
Czech: 32 (0.2%)
Italian: 32 (0.2%)
Croatian: 31 (0.2%)
Ukrainian: 27 (0.1%)
French: 18 (0.10%)
Eastern European: 17 (0.09%)
Romanian: 13 (0.07%)
Danish: 12 (0.07%)
French Canadian: 12 (0.07%)
Scotch-Irish: 11 (0.06%)
Slovene: 11 (0.06%)
Iranian: 10 (0.06%)
Portuguese: 10 (0.06%)
Slovak: 7 (0.04%)
Welsh: 7 (0.04%) Most common places of birth for foreign-born residents (%): Mexico Woodburn:
76.3% (5,972)Oregon:
33.9% (140,109)
Guatemala Woodburn:
14.3% (1,116)Oregon:
1.7% (7,103)
China, excluding Hong Kong and Taiwan Woodburn:
1.9% (152)Oregon:
5.2% (21,429)
Nicaragua Woodburn:
1.6% (129)Oregon:
0.2% (866)
Place of birth for U.S.-born residents:
This state: 11,310Other state: 6,523Northeast: 518Midwest: 1,324South: 1,347West: 3,423 94.2% of Woodburn residents lived in the same house 1 years ago.
Out of people who lived in different houses, 26.0% lived in this county.
Out of people who lived in different counties, 73.9% lived in Oregon.
Woodburn:
94.2%State average:
85.5%
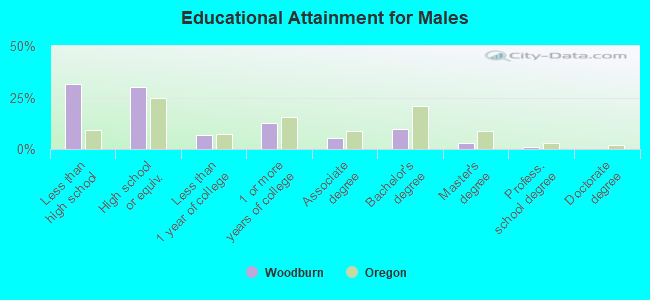
Education attainment for males 25 years and older:
No schooling: 601Nursery to 4th grade: 2205th and 6th grade: 4917th and 8th grade: 3359th grade: 44810th grade: 13611th grade: 13212th grade, no diploma: 178High school graduate (or equivalency): 2,421Less than 1 year of college: 526Some college more than 1 year, no degree: 996Associate degree: 433Bachelor's degree: 776Master's degree: 228Professional school degree: 79Doctorate degree: 18
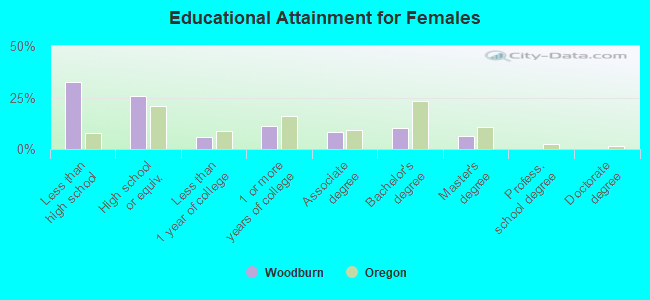
Education attainment for females 25 years and older:
No schooling: 915Nursery to 4th grade: 1465th and 6th grade: 7957th and 8th grade: 6279th grade: 8310th grade: 10111th grade: 20212th grade, no diploma: 224High school graduate (or equivalency): 2,451Less than 1 year of college: 534Some college more than 1 year, no degree: 1,048Associate degree: 775Bachelor's degree: 978Master's degree: 586Professional school degree: 0Doctorate degree: 0
Housing units in structures:
One, detached: 6,132One, attached: 166Two: 2173 or 4: 5805 to 9: 24110 to 19: 30920 to 49: 13650 or more: 893Mobile homes: 647Median worth of mobile homes: $135,277
Housing units lacking complete plumbing facilities in 2022: 2.5%Housing units lacking complete kitchen facilities in 2022: 3.6%House/condo owner moved in on average 10 years ago
Renter moved in on average 6 years ago
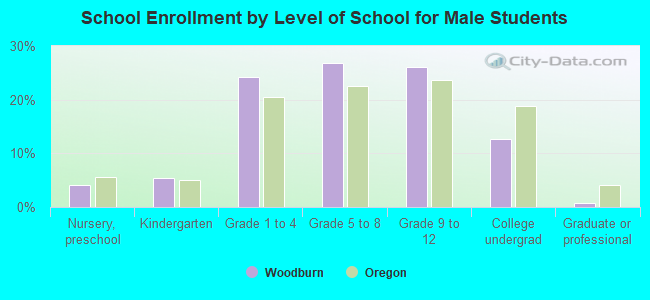
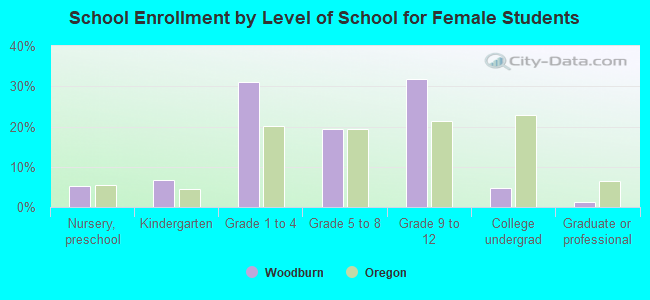
Private vs. public school enrollment:
Students in private schools in grades 1 to 8 (elementary and middle school): 367 Students in private schools in grades 9 to 12 (high school): 74 Students in private undergraduate colleges: 53