Races in Woodburn, Oregon (OR) Detailed Stats
Data:
Races - White alone (%)
Races - White alone (% change since 2000)
Races - Black alone (%)
Races - Black alone (% change since 2000)
Races - American Indian alone (%)
Races - American Indian alone (% change since 2000)
Races - Asian alone (%)
Races - Asian alone (% change since 2000)
Races - Hispanic (%)
Races - Hispanic (% change since 2000)
Races - Native Hawaiian and Other Pacific Islander alone (%)
Races - Native Hawaiian and Other Pacific Islander alone (% change since 2000)
Races - Two or more races(%)
Races - Two or more races(% change since 2000)
Races - Other race alone (%)
Races - Other race alone (% change since 2000)
Racial diversity
Place of birth - Born in state of residence (%)
Place of birth - Born in state of residence (%) - White
Place of birth - Born in state of residence (%) - Black or African American
Place of birth - Born in state of residence (%) - Asian
Place of birth - Born in state of residence (%) - Hispanic or Latino
Place of birth - Born in state of residence (%) - American Indian and Alaska Native
Place of birth - Born in state of residence (%) - Multirace
Place of birth - Born in state of residence (%) - Other Race
Place of birth - Born in other state (%)
Place of birth - Born in other state (%) - White
Place of birth - Born in other state (%) - Black or African American
Place of birth - Born in other state (%) - Asian
Place of birth - Born in other state (%) - Hispanic or Latino
Place of birth - Born in other state (%) - American Indian and Alaska Native
Place of birth - Born in other state (%) - Multirace
Place of birth - Born in other state (%) - Other Race
Place of birth - Native, outside of US (%)
Place of birth - Native, outside of US (%) - White
Place of birth - Native, outside of US (%) - Black or African American
Place of birth - Native, outside of US (%) - Asian
Place of birth - Native, outside of US (%) - Hispanic or Latino
Place of birth - Native, outside of US (%) - American Indian and Alaska Native
Place of birth - Native, outside of US (%) - Multirace
Place of birth - Native, outside of US (%) - Other Race
Place of birth - Foreign born (%)
Place of birth - Foreign born (%) - White
Place of birth - Foreign born (%) - Black or African American
Place of birth - Foreign born (%) - Asian
Place of birth - Foreign born (%) - Hispanic or Latino
Place of birth - Foreign born (%) - American Indian and Alaska Native
Place of birth - Foreign born (%) - Multirace
Place of birth - Foreign born (%) - Other Race
Residents speaking English at home (%)
Residents speaking English at home - Born in the United States (%)
Residents speaking English at home - Native, born elsewhere (%)
Residents speaking English at home - Foreign born (%)
Residents speaking Spanish at home (%)
Residents speaking Spanish at home - Born in the United States (%)
Residents speaking Spanish at home - Native, born elsewhere (%)
Residents speaking Spanish at home - Foreign born (%)
Residents speaking other language at home (%)
Residents speaking other language at home - Born in the United States (%)
Residents speaking other language at home - Native, born elsewhere (%)
Residents speaking other language at home - Foreign born (%)
Marital status - Never married (%)
Marital status - Now married (%)
Marital status - Separated (%)
Marital status - Widowed (%)
Marital status - Divorced (%)
Ancestries Reported - Arab (%)
Ancestries Reported - Czech (%)
Ancestries Reported - Danish (%)
Ancestries Reported - Dutch (%)
Ancestries Reported - English (%)
Ancestries Reported - French (%)
Ancestries Reported - French Canadian (%)
Ancestries Reported - German (%)
Ancestries Reported - Greek (%)
Ancestries Reported - Hungarian (%)
Ancestries Reported - Irish (%)
Ancestries Reported - Italian (%)
Ancestries Reported - Lithuanian (%)
Ancestries Reported - Norwegian (%)
Ancestries Reported - Polish (%)
Ancestries Reported - Portuguese (%)
Ancestries Reported - Russian (%)
Ancestries Reported - Scotch-Irish (%)
Ancestries Reported - Scottish (%)
Ancestries Reported - Slovak (%)
Ancestries Reported - Subsaharan African (%)
Ancestries Reported - Swedish (%)
Ancestries Reported - Swiss (%)
Ancestries Reported - Ukrainian (%)
Ancestries Reported - United States (%)
Ancestries Reported - Welsh (%)
Ancestries Reported - West Indian (%)
Ancestries Reported - Other (%)
Geographical mobility - Same house 1 year ago (%)
Geographical mobility - Same house 1 year ago (%) - White
Geographical mobility - Same house 1 year ago (%) - Black or African American
Geographical mobility - Same house 1 year ago (%) - Asian
Geographical mobility - Same house 1 year ago (%) - Hispanic or Latino
Geographical mobility - Same house 1 year ago (%) - American Indian and Alaska Native
Geographical mobility - Same house 1 year ago (%) - Multirace
Geographical mobility - Same house 1 year ago (%) - Other Race
Geographical mobility - Moved within same county (%)
Geographical mobility - Moved within same county (%) - White
Geographical mobility - Moved within same county (%) - Black or African American
Geographical mobility - Moved within same county (%) - Asian
Geographical mobility - Moved within same county (%) - Hispanic or Latino
Geographical mobility - Moved within same county (%) - American Indian and Alaska Native
Geographical mobility - Moved within same county (%) - Multirace
Geographical mobility - Moved within same county (%) - Other Race
Geographical mobility - Moved from different county within same state (%)
Geographical mobility - Moved from different county within same state (%) - White
Geographical mobility - Moved from different county within same state (%) - Black or African American
Geographical mobility - Moved from different county within same state (%) - Asian
Geographical mobility - Moved from different county within same state (%) - Hispanic or Latino
Geographical mobility - Moved from different county within same state (%) - American Indian and Alaska Native
Geographical mobility - Moved from different county within same state (%) - Multirace
Geographical mobility - Moved from different county within same state (%) - Other Race
Geographical mobility - Moved from different state (%)
Geographical mobility - Moved from different state (%) - White
Geographical mobility - Moved from different state (%) - Black or African American
Geographical mobility - Moved from different state (%) - Asian
Geographical mobility - Moved from different state (%) - Hispanic or Latino
Geographical mobility - Moved from different state (%) - American Indian and Alaska Native
Geographical mobility - Moved from different state (%) - Multirace
Geographical mobility - Moved from different state (%) - Other Race
Geographical mobility - Moved from abroad (%)
Geographical mobility - Moved from abroad (%) - White
Geographical mobility - Moved from abroad (%) - Black or African American
Geographical mobility - Moved from abroad (%) - Asian
Geographical mobility - Moved from abroad (%) - Hispanic or Latino
Geographical mobility - Moved from abroad (%) - American Indian and Alaska Native
Geographical mobility - Moved from abroad (%) - Multirace
Geographical mobility - Moved from abroad (%) - Other Race
Place of birth for the foreign-born population - Ireland (%)
Place of birth for the foreign-born population - Denmark (%)
Place of birth for the foreign-born population - Norway (%)
Place of birth for the foreign-born population - Sweden (%)
Place of birth for the foreign-born population - United Kingdom (%)
Place of birth for the foreign-born population - England (%)
Place of birth for the foreign-born population - Scotland (%)
Place of birth for the foreign-born population - Other Northern Europe (%)
Place of birth for the foreign-born population - Austria (%)
Place of birth for the foreign-born population - Belgium (%)
Place of birth for the foreign-born population - France (%)
Place of birth for the foreign-born population - Germany (%)
Place of birth for the foreign-born population - Netherlands (%)
Place of birth for the foreign-born population - Switzerland (%)
Place of birth for the foreign-born population - Other Western Europe (%)
Place of birth for the foreign-born population - Greece (%)
Place of birth for the foreign-born population - Italy (%)
Place of birth for the foreign-born population - Portugal (%)
Place of birth for the foreign-born population - Spain (%)
Place of birth for the foreign-born population - Other Southern Europe (%)
Place of birth for the foreign-born population - Albania (%)
Place of birth for the foreign-born population - Belarus (%)
Place of birth for the foreign-born population - Bosnia and Herzegovina (%)
Place of birth for the foreign-born population - Bulgaria (%)
Place of birth for the foreign-born population - Croatia (%)
Place of birth for the foreign-born population - Czechoslovakia (%)
Place of birth for the foreign-born population - Hungary (%)
Place of birth for the foreign-born population - Latvia (%)
Place of birth for the foreign-born population - Lithuania (%)
Place of birth for the foreign-born population - North Macedonia (Macedonia) (%)
Place of birth for the foreign-born population - Moldova (%)
Place of birth for the foreign-born population - Poland (%)
Place of birth for the foreign-born population - Romania (%)
Place of birth for the foreign-born population - Russia (%)
Place of birth for the foreign-born population - Serbia (%)
Place of birth for the foreign-born population - Ukraine (%)
Place of birth for the foreign-born population - Other Eastern Europe (%)
Place of birth for the foreign-born population - China (%)
Place of birth for the foreign-born population - Hong Kong (%)
Place of birth for the foreign-born population - Taiwan (%)
Place of birth for the foreign-born population - Japan (%)
Place of birth for the foreign-born population - Korea (%)
Place of birth for the foreign-born population - Other Eastern Asia (%)
Place of birth for the foreign-born population - Afghanistan (%)
Place of birth for the foreign-born population - Bangladesh (%)
Place of birth for the foreign-born population - India (%)
Place of birth for the foreign-born population - Iran (%)
Place of birth for the foreign-born population - Kazakhstan (%)
Place of birth for the foreign-born population - Nepal (%)
Place of birth for the foreign-born population - Pakistan (%)
Place of birth for the foreign-born population - Sri Lanka (%)
Place of birth for the foreign-born population - Uzbekistan (%)
Place of birth for the foreign-born population - Other South Central Asia (%)
Place of birth for the foreign-born population - Burma (%)
Place of birth for the foreign-born population - Cambodia (%)
Place of birth for the foreign-born population - Indonesia (%)
Place of birth for the foreign-born population - Laos (%)
Place of birth for the foreign-born population - Malaysia (%)
Place of birth for the foreign-born population - Philippines (%)
Place of birth for the foreign-born population - Singapore (%)
Place of birth for the foreign-born population - Thailand (%)
Place of birth for the foreign-born population - Vietnam (%)
Place of birth for the foreign-born population - Other South Eastern Asia (%)
Place of birth for the foreign-born population - Armenia (%)
Place of birth for the foreign-born population - Iraq (%)
Place of birth for the foreign-born population - Israel (%)
Place of birth for the foreign-born population - Jordan (%)
Place of birth for the foreign-born population - Kuwait (%)
Place of birth for the foreign-born population - Lebanon (%)
Place of birth for the foreign-born population - Saudi Arabia (%)
Place of birth for the foreign-born population - Syria (%)
Place of birth for the foreign-born population - Turkey (%)
Place of birth for the foreign-born population - Yemen (%)
Place of birth for the foreign-born population - Other Western Asia (%)
Place of birth for the foreign-born population - Eritrea (%)
Place of birth for the foreign-born population - Ethiopia (%)
Place of birth for the foreign-born population - Kenya (%)
Place of birth for the foreign-born population - Somalia (%)
Place of birth for the foreign-born population - Uganda (%)
Place of birth for the foreign-born population - Zimbabwe (%)
Place of birth for the foreign-born population - Other Eastern Africa (%)
Place of birth for the foreign-born population - Cameroon (%)
Place of birth for the foreign-born population - Congo (%)
Place of birth for the foreign-born population - Democratic Republic of Congo (Zaire) (%)
Place of birth for the foreign-born population - Other Middle Africa (%)
Place of birth for the foreign-born population - Egypt (%)
Place of birth for the foreign-born population - Morocco (%)
Place of birth for the foreign-born population - Sudan (%)
Place of birth for the foreign-born population - Other Northern Africa (%)
Place of birth for the foreign-born population - South Africa (%)
Place of birth for the foreign-born population - Other Southern Africa (%)
Place of birth for the foreign-born population - Cabo Verde (%)
Place of birth for the foreign-born population - Ghana (%)
Place of birth for the foreign-born population - Liberia (%)
Place of birth for the foreign-born population - Nigeria (%)
Place of birth for the foreign-born population - Senegal (%)
Place of birth for the foreign-born population - Sierra Leone (%)
Place of birth for the foreign-born population - Other Western Africa (%)
Place of birth for the foreign-born population - Australia (%)
Place of birth for the foreign-born population - New Zealand (%)
Place of birth for the foreign-born population - Fiji (%)
Place of birth for the foreign-born population - Micronesia (%)
Place of birth for the foreign-born population - Bahamas (%)
Place of birth for the foreign-born population - Barbados (%)
Place of birth for the foreign-born population - Cuba (%)
Place of birth for the foreign-born population - Dominica (%)
Place of birth for the foreign-born population - Dominican Republic (%)
Place of birth for the foreign-born population - Grenada (%)
Place of birth for the foreign-born population - Haiti (%)
Place of birth for the foreign-born population - Jamaica (%)
Place of birth for the foreign-born population - St. Vincent and the Grenadines (%)
Place of birth for the foreign-born population - Trinidad and Tobago (%)
Place of birth for the foreign-born population - West Indies (%)
Place of birth for the foreign-born population - Other Caribbean (%)
Place of birth for the foreign-born population - Belize (%)
Place of birth for the foreign-born population - Costa Rica (%)
Place of birth for the foreign-born population - El Salvador (%)
Place of birth for the foreign-born population - Guatemala (%)
Place of birth for the foreign-born population - Honduras (%)
Place of birth for the foreign-born population - Mexico (%)
Place of birth for the foreign-born population - Nicaragua (%)
Place of birth for the foreign-born population - Panama (%)
Place of birth for the foreign-born population - Other Central America (%)
Place of birth for the foreign-born population - Argentina (%)
Place of birth for the foreign-born population - Bolivia (%)
Place of birth for the foreign-born population - Brazil (%)
Place of birth for the foreign-born population - Chile (%)
Place of birth for the foreign-born population - Colombia (%)
Place of birth for the foreign-born population - Ecuador (%)
Place of birth for the foreign-born population - Guyana (%)
Place of birth for the foreign-born population - Peru (%)
Place of birth for the foreign-born population - Uruguay (%)
Place of birth for the foreign-born population - Venezuela (%)
Place of birth for the foreign-born population - Other South America (%)
Place of birth for the foreign-born population - Canada (%)
Place of birth for the foreign-born population - Other Northern America (%)
Place of birth for the foreign-born population - Other (%)
Latest news about races in Woodburn, OR collected exclusively by city-data.com from local newspapers, TV, and radio stations
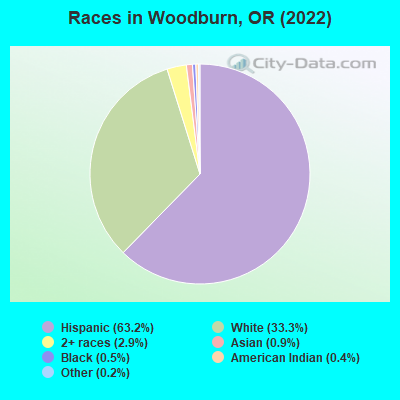
According to 2022 data, the most numerous races in Woodburn, OR are White alone (8,756 residents), Hispanic (16,625 residents), and Two or more races (753 residents). 43.4% of Woodburn residents speak English at home. 29.8% of Woodburn, OR residents are foreign-born (26.8% born in Latin America), which is 69.8% greater than the foreign-born rate of 9.0% across the entire state of Oregon.
Race distribution in Woodburn
2000 2022
2,857,616 83.5% White alone 275,314 8.0% Hispanic 100,333 2.9% Asian alone 82,733 2.4% Two or more races 53,325 1.6% Black alone 40,130 1.2% American Indian alone 7,398 0.2% Native Hawaiian and Other 4,550 0.1% Other race alone
3,037,571 71.6% White alone 609,538 14.4% Hispanic 252,744 6.0% Two or more races 191,283 4.5% Asian alone 78,228 1.8% Black alone 29,399 0.7% American Indian alone 25,731 0.6% Other race alone 15,643 0.4% Native Hawaiian and Other
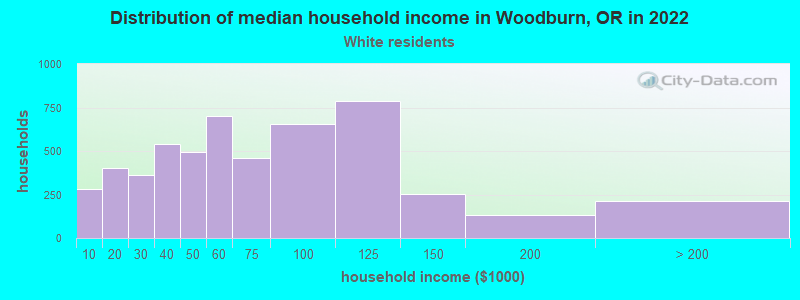
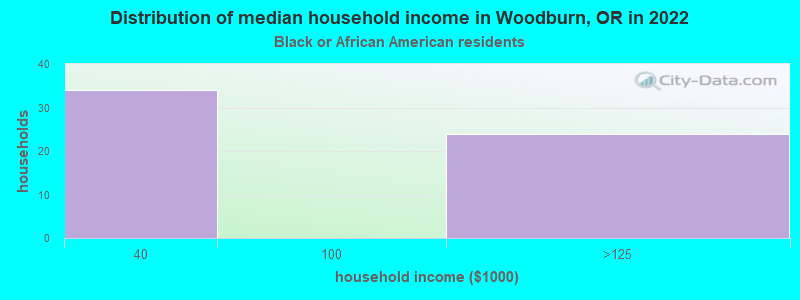
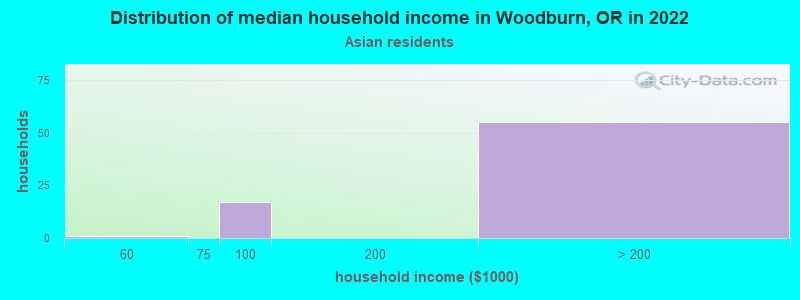
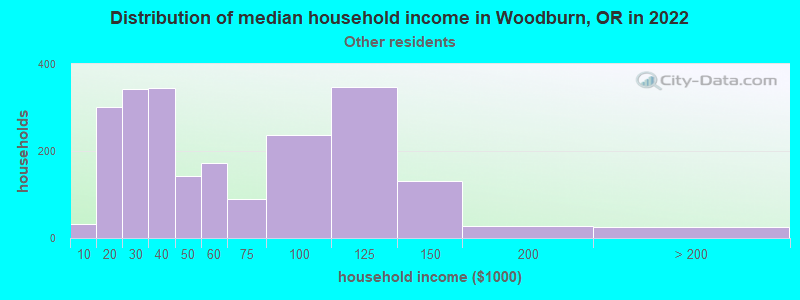
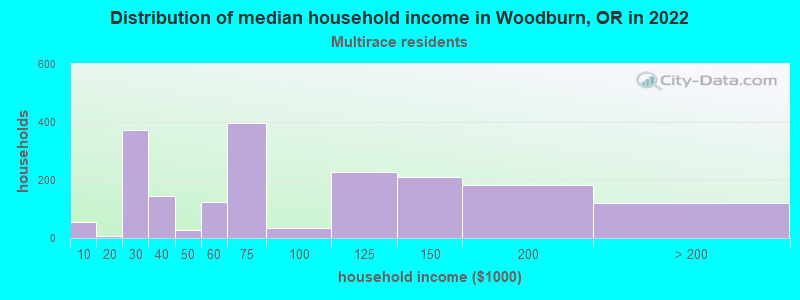
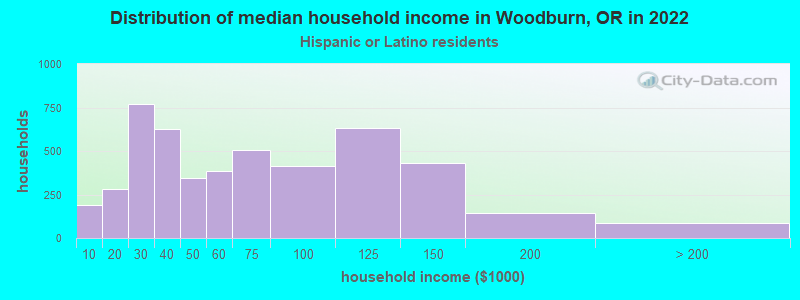
Income and house value in Woodburn Median household income in 2022 $57,665 White non-Hispanic householdersover $200,000 Asian householders$54,039 Some other race householders$61,941 Two or more races householders$57,640 Hispanic or Latino race householdersMedian 2022 house value $325,852 White Non-Hispanic householders$324,410 Black or African American householders $396,501 Asian householders$329,312 Some other race householders$421,301 Two or more races householders$338,540 Hispanic or Latino householders
Median age by race in Woodburn
50.3 Median age for White residents45.9 53.3 38.1 Median age for Black or African American residents-656,804,733.1 14.1 43.6 Median age for American Indian / Alaska Native residents39.7 41.8 53.9 Median age for Asian residents61.6 48.7 -899,543,378.1 Median age for Native Hawaiian / Pacific Islander residents-966,942,147.8 -866,666,665.8 23.1 Median age for Other race residents24.5 22.1 38.1 Median age for Two or more races residents40.5 37.4 59.7 Median age for White alone residents57.5 61.5 28.5 Median age for Hispanic or Latino residents30.0 27.9
Owner/renter occupied households by race in Woodburn
House owners and renters - White residents 4,066 76.1% Owner occupied1,280 23.9% Renter occupiedHouse owners and renters - Black or African American residents 34 100.0% Owner occupiedHouse owners and renters - American Indian / Alaska Native residents 56 32.7% Owner occupied115 67.3% Renter occupiedHouse owners and renters - Asian residents 65 98.2% Owner occupied1 1.8% Renter occupiedHouse owners and renters - Other race residents 575 28.7% Owner occupied1,427 71.3% Renter occupiedHouse owners and renters - Two or more races residents 1,626 72.9% Owner occupied606 27.1% Renter occupiedHouse owners and renters - White alone residents 3,552 82.2% Owner occupied768 17.8% Renter occupiedHouse owners and renters - Hispanic or Latino residents 2,174 45.8% Owner occupied2,570 54.2% Renter occupied
Language usage in Woodburn
English speakers - Total 43.4% of residents of Woodburn speak English at home.
54.1% of residents speak Spanish at home 6,269 46.6% Speak English very well7,193 53.4% Speak English less than very well4.5% of residents speak other language at home 486 43.2% Speak English very well640 56.8% Speak English less than very well
English speakers - Born in the United States 81.6% of residents of Woodburn speak English at home.
16.1% of residents speak Spanish at home 888 85.3% Speak English very well153 14.7% Speak English less than very well0.4% of residents speak other language at home 18 62.1% Speak English very well11 37.9% Speak English less than very well
English speakers - Native, born elsewhere 55.0% of residents of Woodburn speak English at home.
27.2% of residents speak Spanish at home 56 65.9% Speak English very well29 34.1% Speak English less than very well6.7% of residents speak other language at home 21 100.0% Speak English less than very well
English speakers - Foreign-born 7.5% of residents of Woodburn speak English at home.
87.0% of residents speak Spanish at home 1,232 16.0% Speak English very well6,482 84.0% Speak English less than very well9.4% of residents speak other language at home 202 24.2% Speak English very well631 75.8% Speak English less than very well
White (Caucasian) - Speak only English Native:
79.7% (8,170)Foreign-born:
28.7% (423)
White (Caucasian) - Speak another language Native:
12.4% (1,275)Foreign-born:
70.4% (1,037)
American Indian / Alaska Native - Speak only English Native:
49.7% (127)Foreign-born:
7.1% (16)
American Indian / Alaska Native - Speak another language Native:
49.8% (128)Foreign-born:
93.5% (205)
Other race - Speak only English Native:
12.9% (405)Foreign-born:
3.9% (161)
Other race - Speak another language Native:
84.6% (2,662)Foreign-born:
96.2% (3,952)
Two or more races - Speak only English Native:
44.8% (1,459)Foreign-born:
0.5% (15)
Two or more races - Speak another language Native:
56.9% (1,851)Foreign-born:
99.8% (2,969)
White alone - Speak only English Native:
94.4% (7,537)Foreign-born:
38.0% (230)
White alone - Speak another language Native:
4.4% (350)Foreign-born:
62.4% (378)
Hispanic or Latino - Speak only English Native:
21.4% (1,623)Foreign-born:
4.8% (386)
Hispanic or Latino - Speak another language Native:
77.7% (5,897)Foreign-born:
95.1% (7,687)
Foreign-born residents in Woodburn 7,826 residents are foreign born (26.8% Latin America ).
This city:
29.8%Oregon:
9.8%
Marital status for residents in Woodburn Marital status - White (Caucasian) population 15 years and over
Males 33.3% Never married47.1% Now married1.7% Separated3.7% Widowed14.2% DivorcedFemales 22.5% Never married40.5% Now married1.1% Separated14.7% Widowed21.2% DivorcedWomen who gave birth in the past 12 months Now married:
88.8% (70)Unmarried:
11.2% (9)
Women who did not give birth in the past 12 months Now married:
42.5% (972)Unmarried:
57.5% (1,317)
Marital status - Black or African American population 15 years and over
Males 0.0% Never married48.0% Now married0.0% Separated0.0% Widowed52.0% DivorcedFemales 0.0% Never married100.0% Now married0.0% Separated0.0% Widowed0.0% DivorcedWomen who did not give birth in the past 12 months Now married:
100.0% (21)Unmarried:
0.0% (0)
Marital status - American Indian / Alaska Native population 15 years and over
Males 26.1% Never married70.0% Now married0.0% Separated3.9% Widowed0.0% DivorcedFemales 16.3% Never married63.9% Now married19.7% Separated0.0% Widowed0.0% DivorcedWomen who did not give birth in the past 12 months Now married:
80.8% (110)Unmarried:
19.2% (26)
Marital status - Asian population 15 years and over
Males 0.0% Never married80.2% Now married19.8% Separated0.0% Widowed0.0% DivorcedFemales 6.4% Never married87.3% Now married0.0% Separated6.4% Widowed0.0% DivorcedWomen who did not give birth in the past 12 months Now married:
91.8% (125)Unmarried:
8.2% (11)
Marital status - Other race population 15 years and over
Males 29.3% Never married55.3% Now married7.8% Separated0.0% Widowed7.6% DivorcedFemales 37.3% Never married53.2% Now married4.8% Separated3.6% Widowed1.1% DivorcedWomen who gave birth in the past 12 months Now married:
25.9% (19)Unmarried:
74.1% (55)
Women who did not give birth in the past 12 months Now married:
58.7% (1,457)Unmarried:
41.3% (1,023)
Marital status - Two or more races population 15 years and over
Males 46.0% Never married41.6% Now married0.0% Separated0.2% Widowed12.3% DivorcedFemales 40.4% Never married35.5% Now married0.7% Separated14.8% Widowed8.6% DivorcedWomen who gave birth in the past 12 months Now married:
28.2% (14)Unmarried:
71.8% (35)
Women who did not give birth in the past 12 months Now married:
21.0% (262)Unmarried:
79.0% (986)
Marital status - White alone, not Hispanic / Latino population 15 years and over
Males 24.9% Never married49.8% Now married1.4% Separated5.7% Widowed18.2% DivorcedFemales 17.3% Never married39.7% Now married1.3% Separated18.4% Widowed23.3% DivorcedWomen who gave birth in the past 12 months Now married:
100.0% (53)Unmarried:
0.0% (0)
Women who did not give birth in the past 12 months Now married:
47.2% (652)Unmarried:
52.8% (730)
Marital status - Hispanic or Latino population 15 years and over
Males 40.4% Never married47.2% Now married3.8% Separated0.0% Widowed8.6% DivorcedFemales 39.1% Never married44.1% Now married2.1% Separated7.6% Widowed7.1% DivorcedWomen who gave birth in the past 12 months Now married:
32.8% (39)Unmarried:
67.2% (81)
Women who did not give birth in the past 12 months Now married:
43.2% (1,761)Unmarried:
56.8% (2,313)
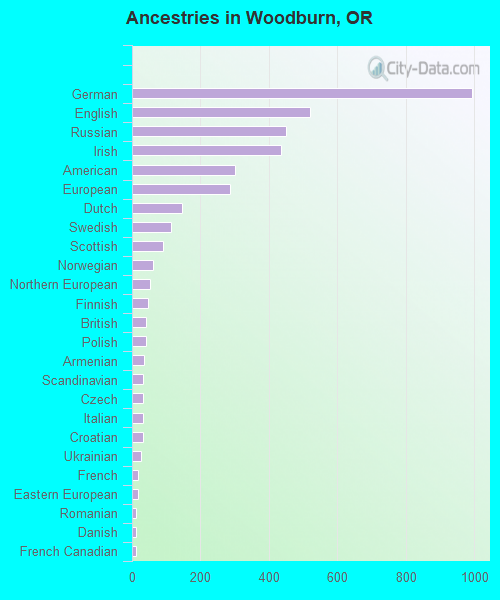
Ancestries in Woodburn
994 5.5% German519 2.9% English451 2.5% Russian437 2.4% Irish302 1.7% American287 1.6% European146 0.8% Dutch113 0.6% Swedish90 0.5% Scottish62 0.3% Norwegian54 0.3% Northern European46 0.3% Finnish40 0.2% British40 0.2% Polish34 0.2% Armenian33 0.2% Scandinavian32 0.2% Czech32 0.2% Italian31 0.2% Croatian27 0.1% Ukrainian18 0.10% French17 0.09% Eastern European13 0.07% Romanian12 0.07% Danish12 0.07% French Canadian11 0.06% Scotch-Irish11 0.06% Slovene10 0.06% Iranian10 0.06% Portuguese7 0.04% Slovak7 0.04% Welsh
Geographical mobility in Woodburn Same house 1 year ago 11,596 90.4% White (Caucasian)134 100.0% Black or African American401 96.5% American Indian / Alaska Native234 88.8% Asian7,191 96.0% Other race6,230 100.0% Two or more races7,689 87.9% White alone, not Hispanic / Latino15,956 97.5% Hispanic or LatinoMoved within same county 359 2.8% White / Caucasian14 3.4% American Indian / Alaska Native3 1.3% Asian18 0.2% Other race189 3.1% Two or more races178 2.0% White alone, not Hispanic / Latino382 2.3% Hispanic or LatinoMoved within same state 694 5.4% White / Caucasian25 9.4% Asian85 1.1% Other race7 0.1% Two or more races679 7.8% White alone, not Hispanic / Latino94 0.6% Hispanic or LatinoMoved from different state 254 2.0% White / Caucasian268 3.1% White alone, not Hispanic / LatinoMoved from abroad 32 0.3% White8 3.1% Asian13 0.2% White alone, not Hispanic / Latino13 0.1% Hispanic or Latino
Children Nativity (place of birth) in Woodburn
Children under 6 years - Living with two parents Both parents native 403 100.0% NativeBoth parents foreign-born 390 100.0% NativeOne native, one foreign-born parent 223 100.0% NativeChildren under 6 years - Living with one parent Native parent 402 100.0% NativeForeign-born parent 289 100.0% NativeChildren 6 to 17 years - Living with two parents Both parents native 309 59.1% Native214 40.9% Foreign-bornBoth parents foreign-born 1,742 91.9% Native154 8.1% Foreign-bornOne native, one foreign-born parent 549 100.0% NativeChildren 6 to 17 years - Living with one parent Native parent 725 100.0% NativeForeign-born parent 967 55.0% Native790 45.0% Foreign-born
Grandparents responsible for own grandchildren in Woodburn
Grandparents (30 to 59 years) White / Caucasian 115 100.0% Not responsible for grandchildrenAmerican Indian / Alaska Native 2 100.0% Not responsible for grandchildrenOther race 105 100.0% Not responsible for grandchildrenTwo or more races 215 100.0% Not responsible for grandchildrenWhite alone, not Hispanic / Latino 63 100.0% Not responsible for grandchildrenHispanic or Latino 269 100.0% Not responsible for grandchildrenGrandparents (60 years and over) White / Caucasian 91 41.8% Responsible for grandchildren127 58.2% Not responsible for grandchildrenOther race 17 25.7% Responsible for grandchildren48 74.3% Not responsible for grandchildrenTwo or more races 133 100.0% Not responsible for grandchildrenWhite alone, not Hispanic / Latino 21 21.0% Responsible for grandchildren80 79.0% Not responsible for grandchildrenHispanic or Latino 66 28.1% Responsible for grandchildren169 71.9% Not responsible for grandchildren