Wrentham: Fire Incidents, Massachusetts (MA)
Where are fire incidents reported in Wrentham, MA
Something went wrong! Please refresh the page.
| Fire incidents reported | |
|---|---|
| Sreet name | Count |
| SOUTH STREET | 188 |
| PREMIUM OUTLET BOULEVARD | 176 |
| EAST STREET | 120 |
| WEST STREET | 106 |
| FRANKLIN STREET | 92 |
| TAUNTON STREET | 86 |
| CREEK STREET | 70 |
| DEDHAM STREET | 66 |
| WASHINGTON STREET | 64 |
| FINCH ROAD | 40 |
| ROUTE 495 NORTH | 38 |
| SHEARS STREET | 38 |
| ROUTE 495 SOUTH | 36 |
| MADISON STREET | 32 |
| SMITH AVENUE | 32 |
| GREELEY AVENUE | 26 |
| NORTH STREET | 26 |
| PROUTY DRIVE | 26 |
| THURSTON STREET | 26 |
| CUSHING DRIVE | 24 |
| CURTIS AVENUE | 22 |
| GREEN STREET | 22 |
| PARK STREET | 22 |
| ARNOLD STREET | 20 |
| COMMON STREET | 20 |
| RANDALL ROAD | 20 |
| EMERALD STREET | 14 |
| INDUSTRIAL ROAD | 12 |
| AUTUMN ROAD | 10 |
| CHESTNUT STREET | 10 |
2002 - 2018 National Fire Incident Reporting System (NFIRS) incidents
- Incident types reported to NFIRS in Wrentham, MA
- 7,74450.7%Rescue & EMS
- 1,86012.2%Service Call
- 1,69711.1%Hazardous Condition
- 1,3689.0%Special Incident
- 1,2057.9%Fire
- 8765.7%False Alarm
- 5203.4%Good Intent Call
- Fire incident types reported to NFIRS in Wrentham, MA
- 60250.0%Other
- 25421.1%Structure Fires
- 23319.3%Outside Fires
- 1169.6%Mobile Property/Vehicle Fires
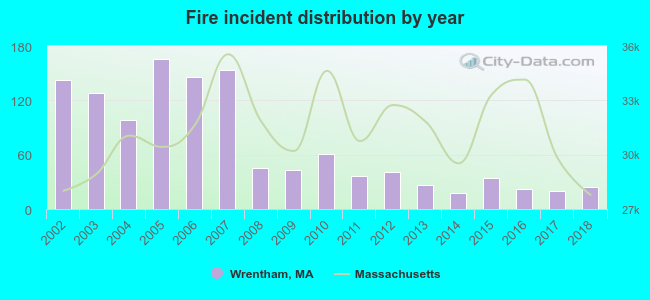 Based on the data from the years 2002 - 2018 the average number of fires per year is 71. The highest number of reported fires - 166 took place in 2005, and the least - 18 in 2014. The data has a dropping trend.
The average number of yearly fire incidents per 10k residents in Wrentham, MA compared to nearest cities:
(Note: Based on data for the last 3 years, including only cities with population 5,000 and above)
| Wrentham: | 20.1 |
| Plainville: | 44.0 |
| Norfolk: | 60.0 |
| Franklin: | 22.5 |
| Foxborough: | 96.0 |
| Mansfield: | 27.7 |
| Millis: | 6.3 |
| Medway: | 42.1 |
| Walpole: | 123.4 |
 The median response time based on all reported fire incidents is 2 minutes. This is much lower compared to the Massachusetts median value.
The median response time in Wrentham, MA compared to nearest cities:
(Note: Based on data for all years, including only cities with at least 500 fire incidents)
| Wrentham: | 2 minutes |
| Plainville: | 4 minutes |
| Norfolk: | 3 minutes |
| Franklin: | 6 minutes |
| Foxborough: | 5 minutes |
| Mansfield: | 5 minutes |
| Bellingham: | 7 minutes |
| Walpole: | 3 minutes |
| Sharon: | 5 minutes |
 37.3% incidents where reported in the morning and 62.7% in the evening. The most fires (15.8%) took place on Friday, and the least (13.1%) on Sunday.
 According to the 1,205 fires from years 2002 - 2018 most fires (13.5%) took place during April, and the least (6.4%) in October.
 Out of all 15,282 cases reported during the years 2002 - 2018, the most belonged to the categories: Rescue & EMS (50.7%), Service Call (12.2%), and Hazardous Condition (11.1%).
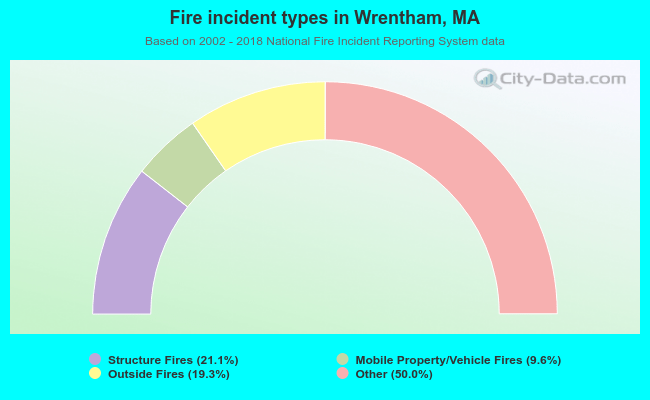 When looking into fire subcategories, the most incidents belonged to: Other (50.0%), and Structure Fires (21.1%).