Medway: Fire Incidents, Massachusetts (MA)
Where are fire incidents reported in Medway, MA
Something went wrong! Please refresh the page.
|
| |||||||||||||||||||||||||||||||||||||||||||||||||||||||||||||||||||||||||||||||||||||||||||||||||||||||||||||
2002 - 2018 National Fire Incident Reporting System (NFIRS) incidents
- Incident types reported to NFIRS in Medway, MA
- 3,39855.4%Rescue & EMS
- 91915.0%Hazardous Condition
- 5899.6%False Alarm
- 4587.5%Fire
- 3876.3%Service Call
- 3175.2%Good Intent Call
- 400.7%Severe Weather
- 210.3%Overpressure Rupture
- Fire incident types reported to NFIRS in Medway, MA
- 31869.4%Structure Fires
- 9420.5%Outside Fires
- 316.8%Mobile Property/Vehicle Fires
- 153.3%Other
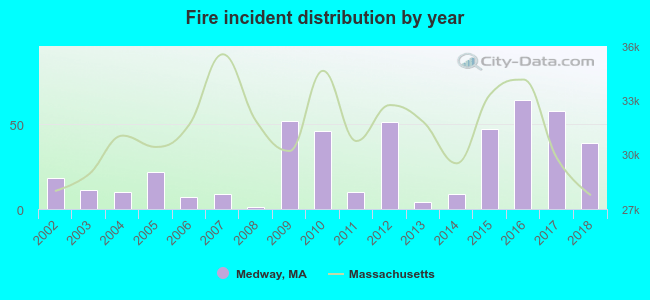 According to the data from the years 2002 - 2018 the average number of fires per year is 27. The highest number of reported fire incidents - 64 took place in 2016, and the least - 1 in 2008. The data has a growing trend.
The average number of yearly fire incidents per 10k residents in Medway, MA compared to nearest cities:
(Note: Based on data for the last 3 years, including only cities with population 5,000 and above)
| Medway: | 42.1 |
| Holliston: | 5.2 |
| Millis: | 6.3 |
| Franklin: | 22.5 |
| Milford: | 41.4 |
| Norfolk: | 60.0 |
| Medfield: | 29.8 |
| Mendon: | 15.4 |
| Wrentham: | 20.1 |

 31.2% incidents where reported in the morning and 68.8% in the evening. The most fires (15.9%) took place on Friday, and the least (12.9%) on Wednesday.
 According to the 458 fires from years 2002 - 2018 most fires (13.1%) took place during July, and the least (5.0%) in October.
 Out of all 6,135 cases reported during the years 2002 - 2018, the most belonged to the categories: Rescue & EMS (55.4%), Hazardous Condition (15.0%), and False Alarm (9.6%).
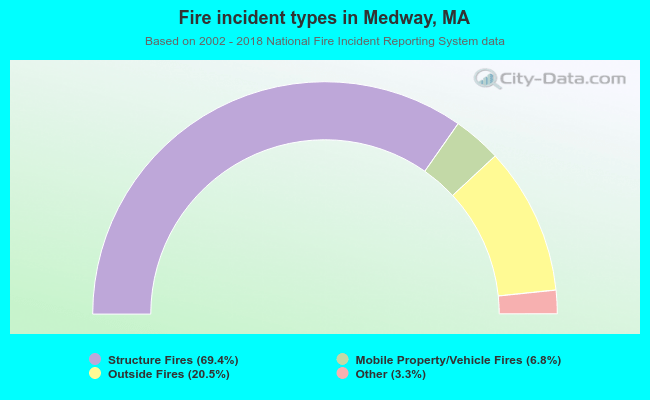 When looking into fire subcategories, the most incidents belonged to: Structure Fires (69.4%), and Outside Fires (20.5%).